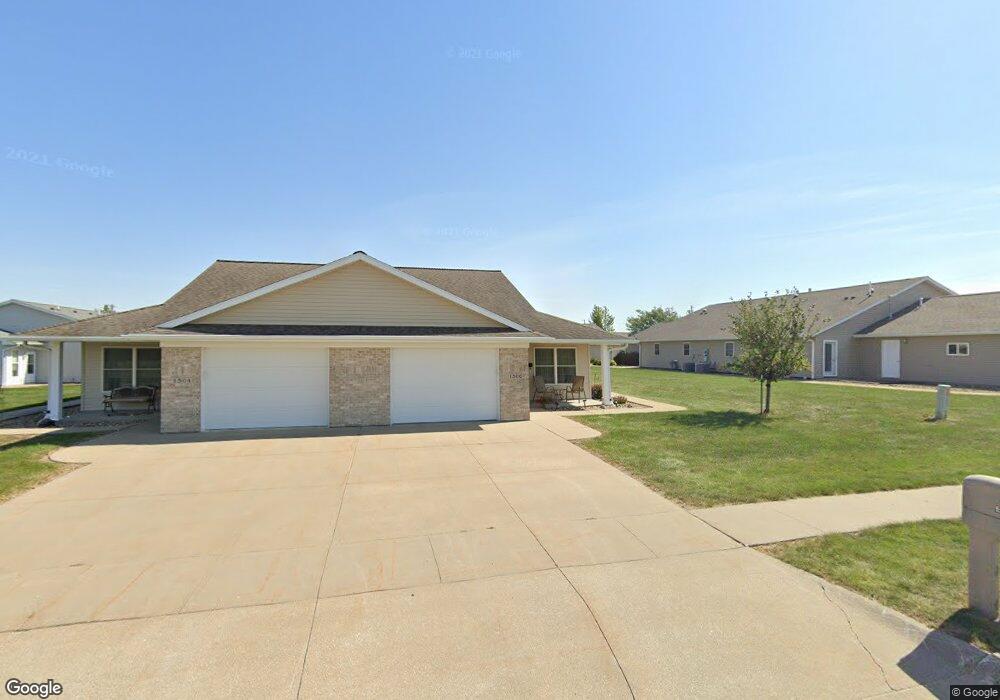
1506 11th Ave Vinton, IA 52349
Estimated Value: $174,398 - $221,000
2
Beds
2
Baths
1,298
Sq Ft
$154/Sq Ft
Est. Value
About This Home
This home is located at 1506 11th Ave, Vinton, IA 52349 and is currently estimated at $200,100, approximately $154 per square foot. 1506 11th Ave is a home located in Benton County with nearby schools including Tilford Elementary School, Shellsburg Elementary School, and Vinton-Shellsburg Middle School.
Ownership History
Date
Name
Owned For
Owner Type
Purchase Details
Closed on
Sep 19, 2005
Sold by
Bascom Vernon L and Bascom Sandra E
Bought by
Olson David L
Current Estimated Value
Home Financials for this Owner
Home Financials are based on the most recent Mortgage that was taken out on this home.
Original Mortgage
$107,200
Outstanding Balance
$57,928
Interest Rate
6.01%
Mortgage Type
New Conventional
Estimated Equity
$142,172
Create a Home Valuation Report for This Property
The Home Valuation Report is an in-depth analysis detailing your home's value as well as a comparison with similar homes in the area
Home Values in the Area
Average Home Value in this Area
Purchase History
| Date | Buyer | Sale Price | Title Company |
|---|---|---|---|
| Olson David L | $134,000 | None Available |
Source: Public Records
Mortgage History
| Date | Status | Borrower | Loan Amount |
|---|---|---|---|
| Open | Olson David L | $107,200 |
Source: Public Records
Tax History Compared to Growth
Tax History
| Year | Tax Paid | Tax Assessment Tax Assessment Total Assessment is a certain percentage of the fair market value that is determined by local assessors to be the total taxable value of land and additions on the property. | Land | Improvement |
|---|---|---|---|---|
| 2025 | $2,120 | $143,900 | $0 | $143,900 |
| 2024 | $2,120 | $145,500 | $12,700 | $132,800 |
| 2023 | $2,330 | $145,500 | $12,700 | $132,800 |
| 2022 | $2,388 | $120,500 | $10,200 | $110,300 |
| 2021 | $2,388 | $120,500 | $10,200 | $110,300 |
| 2020 | $2,292 | $118,100 | $6,800 | $111,300 |
| 2019 | $2,292 | $118,100 | $6,800 | $111,300 |
| 2018 | $2,220 | $116,300 | $6,400 | $109,900 |
| 2017 | $2,126 | $116,300 | $6,400 | $109,900 |
| 2016 | $2,086 | $108,700 | $6,000 | $102,700 |
| 2015 | $2,086 | $108,700 | $6,000 | $102,700 |
| 2014 | $2,154 | $111,600 | $0 | $0 |
Source: Public Records
Map
Nearby Homes