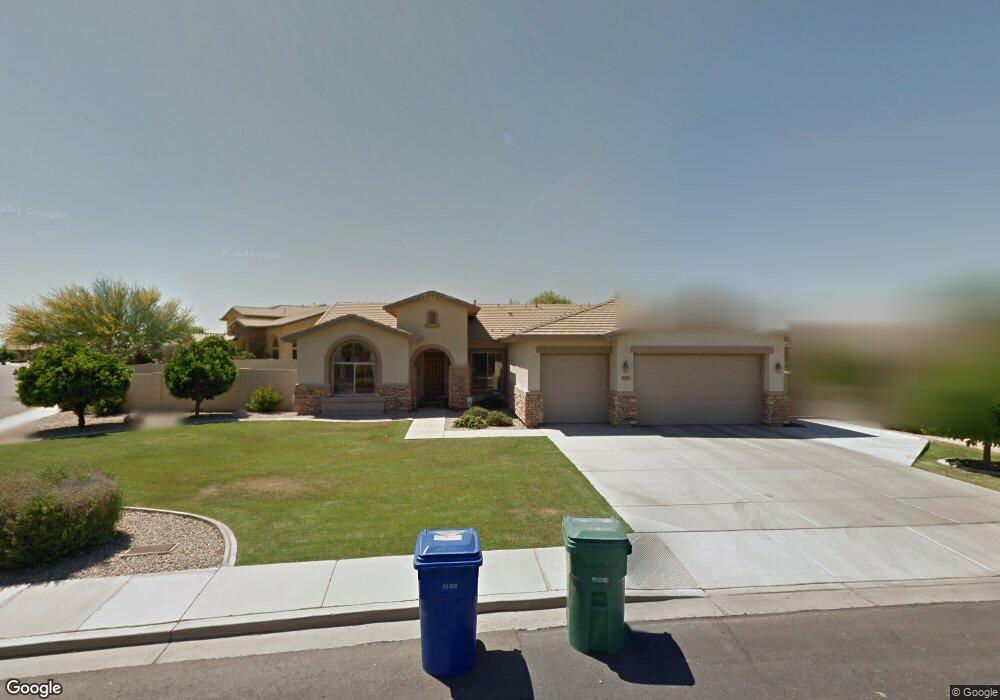
1506 N Los Alamos Cir Mesa, AZ 85213
Citrus NeighborhoodEstimated Value: $646,357 - $815,000
--
Bed
3
Baths
2,547
Sq Ft
$296/Sq Ft
Est. Value
About This Home
This home is located at 1506 N Los Alamos Cir, Mesa, AZ 85213 and is currently estimated at $753,589, approximately $295 per square foot. 1506 N Los Alamos Cir is a home located in Maricopa County with nearby schools including Hale Elementary School, Franklin at Brimhall Elementary School, and Franklin West Elementary School.
Ownership History
Date
Name
Owned For
Owner Type
Purchase Details
Closed on
Nov 4, 2010
Sold by
Hawley Denns R and Hawley Lisa Jo
Bought by
Hawley Dennis R and Hawley Lisa Jo
Current Estimated Value
Purchase Details
Closed on
Oct 31, 2002
Sold by
Hawley Dennis R and Hawley Lisa Jo
Bought by
Hawley Dennis R and Hawley Lisa Jo
Home Financials for this Owner
Home Financials are based on the most recent Mortgage that was taken out on this home.
Original Mortgage
$101,200
Interest Rate
6.06%
Purchase Details
Closed on
Oct 6, 1999
Sold by
Del Webbs Coventry Homes Inc
Bought by
Hawley Dennis R and Hawley Lisa Jo
Home Financials for this Owner
Home Financials are based on the most recent Mortgage that was taken out on this home.
Original Mortgage
$112,000
Interest Rate
8.21%
Mortgage Type
New Conventional
Create a Home Valuation Report for This Property
The Home Valuation Report is an in-depth analysis detailing your home's value as well as a comparison with similar homes in the area
Home Values in the Area
Average Home Value in this Area
Purchase History
| Date | Buyer | Sale Price | Title Company |
|---|---|---|---|
| Hawley Dennis R | -- | None Available | |
| Hawley Dennis R | -- | -- | |
| Hawley Dennis R | -- | American Title Ins Agency Az | |
| Hawley Dennis R | $220,891 | First American Title | |
| Del Webbs Coventry Homes Inc | -- | First American Title |
Source: Public Records
Mortgage History
| Date | Status | Borrower | Loan Amount |
|---|---|---|---|
| Closed | Hawley Dennis R | $101,200 | |
| Previous Owner | Hawley Dennis R | $112,000 |
Source: Public Records
Tax History Compared to Growth
Tax History
| Year | Tax Paid | Tax Assessment Tax Assessment Total Assessment is a certain percentage of the fair market value that is determined by local assessors to be the total taxable value of land and additions on the property. | Land | Improvement |
|---|---|---|---|---|
| 2025 | $3,287 | $38,625 | -- | -- |
| 2024 | $3,319 | $36,785 | -- | -- |
| 2023 | $3,319 | $47,150 | $9,430 | $37,720 |
| 2022 | $3,248 | $37,670 | $7,530 | $30,140 |
| 2021 | $3,322 | $38,060 | $7,610 | $30,450 |
| 2020 | $3,276 | $34,610 | $6,920 | $27,690 |
| 2019 | $3,039 | $30,630 | $6,120 | $24,510 |
| 2018 | $2,899 | $30,650 | $6,130 | $24,520 |
| 2017 | $2,810 | $30,520 | $6,100 | $24,420 |
| 2016 | $2,745 | $30,150 | $6,030 | $24,120 |
| 2015 | $2,600 | $28,850 | $5,770 | $23,080 |
Source: Public Records
Map
Nearby Homes
- 1515 N Los Alamos Cir
- 3039 E Hope St
- 3060 E Hope St
- 2939 E Huber St
- 3211 E Hope Cir
- 3041 E Backus Rd
- 3233 E Indigo Cir Unit 167
- 3026 E Backus Rd
- 2830 E Brown Rd Unit 10
- 1525 N 25th St
- 2015 N Los Alamos
- 2050 N 28th Place
- 3452 E Jaeger Cir
- 2560 E Fairfield St
- 3134 E Mckellips Rd Unit 178
- 3305 E Kenwood St
- 2534 E Fairfield St
- 2548 E Encanto St
- 2560 E Elmwood St
- 2353 E Brown Rd
- 1518 N Los Alamos Cir
- 2958 E Hope St
- 2959 E Hope St
- 1503 N Los Alamos Cir
- 2950 E Hope St
- 2931 E Hale St
- 1461 N Los Alamos
- 1530 N Los Alamos Cir
- 2951 E Hope St
- 2913 E Hale St
- 2939 E Hale St
- 1527 N Los Alamos Cir
- 2923 E Hale St
- 1449 N Los Alamos
- 2942 E Hope St
- 2915 E Hale St
- 2947 E Hale St
- 2943 E Hope St
- 2960 E Hackamore St
- 1437 N Los Alamos