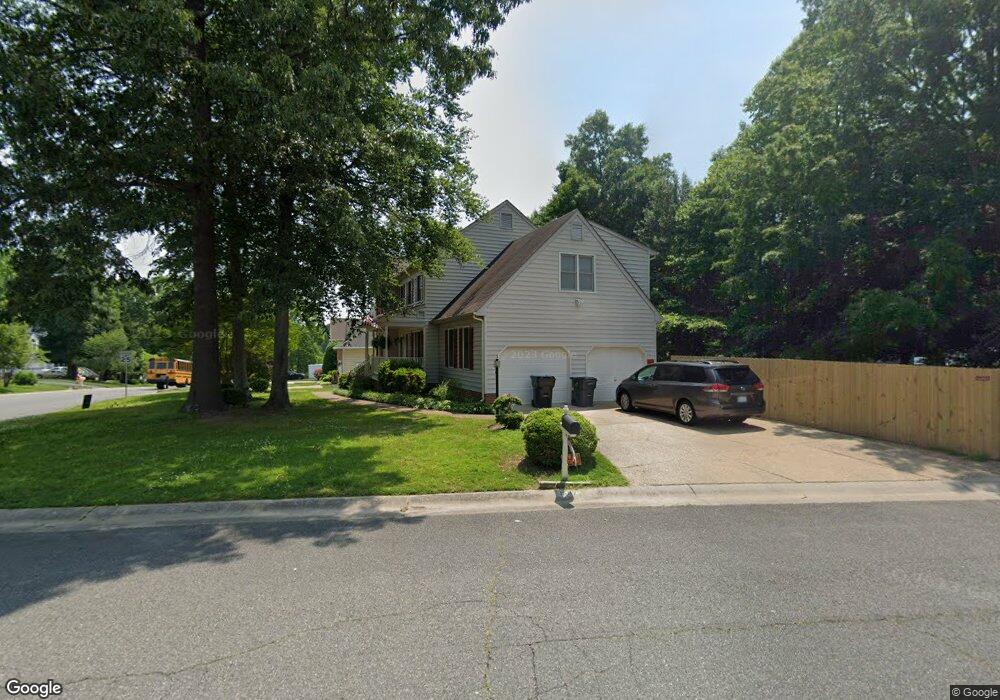
1507 Walden Springs Dr Midlothian, VA 23114
Estimated Value: $448,661 - $504,000
4
Beds
3
Baths
2,328
Sq Ft
$205/Sq Ft
Est. Value
About This Home
This home is located at 1507 Walden Springs Dr, Midlothian, VA 23114 and is currently estimated at $478,165, approximately $205 per square foot. 1507 Walden Springs Dr is a home located in Chesterfield County with nearby schools including W W Gordon Elementary School, Midlothian Middle School, and Monacan High School.
Ownership History
Date
Name
Owned For
Owner Type
Purchase Details
Closed on
Nov 10, 2011
Sold by
Lane Diron S
Bought by
Rule Steven R
Current Estimated Value
Home Financials for this Owner
Home Financials are based on the most recent Mortgage that was taken out on this home.
Original Mortgage
$184,000
Outstanding Balance
$125,894
Interest Rate
4.09%
Mortgage Type
New Conventional
Estimated Equity
$352,271
Purchase Details
Closed on
Jul 28, 2008
Sold by
Averette David S
Bought by
Lane Diron S
Home Financials for this Owner
Home Financials are based on the most recent Mortgage that was taken out on this home.
Original Mortgage
$272,000
Interest Rate
6.4%
Mortgage Type
New Conventional
Purchase Details
Closed on
Mar 31, 2000
Sold by
Cudzik John D
Bought by
Averette David S and Averette Nicole L
Home Financials for this Owner
Home Financials are based on the most recent Mortgage that was taken out on this home.
Original Mortgage
$135,960
Interest Rate
8.4%
Mortgage Type
New Conventional
Create a Home Valuation Report for This Property
The Home Valuation Report is an in-depth analysis detailing your home's value as well as a comparison with similar homes in the area
Home Values in the Area
Average Home Value in this Area
Purchase History
| Date | Buyer | Sale Price | Title Company |
|---|---|---|---|
| Rule Steven R | $230,000 | -- | |
| Lane Diron S | $285,700 | -- | |
| Averette David S | $170,000 | -- |
Source: Public Records
Mortgage History
| Date | Status | Borrower | Loan Amount |
|---|---|---|---|
| Open | Rule Steven R | $184,000 | |
| Previous Owner | Lane Diron S | $272,000 | |
| Previous Owner | Averette David S | $135,960 |
Source: Public Records
Tax History
| Year | Tax Paid | Tax Assessment Tax Assessment Total Assessment is a certain percentage of the fair market value that is determined by local assessors to be the total taxable value of land and additions on the property. | Land | Improvement |
|---|---|---|---|---|
| 2025 | $3,592 | $400,800 | $71,000 | $329,800 |
| 2024 | $3,592 | $392,200 | $66,000 | $326,200 |
| 2023 | $3,433 | $377,300 | $64,000 | $313,300 |
| 2022 | $3,266 | $355,000 | $62,000 | $293,000 |
| 2021 | $3,036 | $312,600 | $60,000 | $252,600 |
| 2020 | $2,787 | $293,400 | $57,000 | $236,400 |
| 2019 | $2,748 | $289,300 | $57,000 | $232,300 |
| 2018 | $2,657 | $279,700 | $54,000 | $225,700 |
| 2017 | $2,522 | $262,700 | $53,000 | $209,700 |
| 2016 | $2,465 | $256,800 | $53,000 | $203,800 |
| 2015 | $2,355 | $242,700 | $52,000 | $190,700 |
| 2014 | $2,322 | $239,300 | $52,000 | $187,300 |
Source: Public Records
Map
Nearby Homes
- 11906 Lockett Ridge Place
- 11625 Nevis Dr
- 1806 Providence Creek Cir
- 1304 Logan Trace Ct
- 1137 Westcreek Dr
- 11301 Mansfield Crossing Ct
- 11419 Briarhurst Rd
- 11218 W Providence Rd
- 12421 Brimfield Ln
- 901 Meadowcreek Dr
- 1416 Quiet Lake Loop
- 11512 Mcnair Cir
- 2611 Quisenberry St
- 12312 Beaver Hollow Ct
- 2604 Brookforest Terrace
- 11101 Pennway Dr
- 12601 Cottage Mill Rd
- 636 Coralberry Dr
- 1331 Burlington Rd
- 12503 Needle Rush Way
- 11713 Explorer Dr
- 1511 Walden Springs Dr
- 1907 Porters Mill Rd
- 1506 Walden Springs Dr
- 11707 Explorer Dr
- 1913 Porters Mill Rd
- 1503 Walden Springs Dr
- 1502 Walden Springs Dr
- 11712 Explorer Dr
- 1512 Walden Springs Dr
- 11807 Owlsnest Ct
- 11701 Explorer Dr
- 1919 Porters Mill Rd
- 11806 Owlsnest Ct
- 11706 Explorer Dr
- 1817 Porters Mill Rd
- 1906 Porters Mill Rd
- 1900 Porters Mill Rd
- 1501 Walden Springs Dr
- 1912 Porters Mill Rd
Your Personal Tour Guide
Ask me questions while you tour the home.