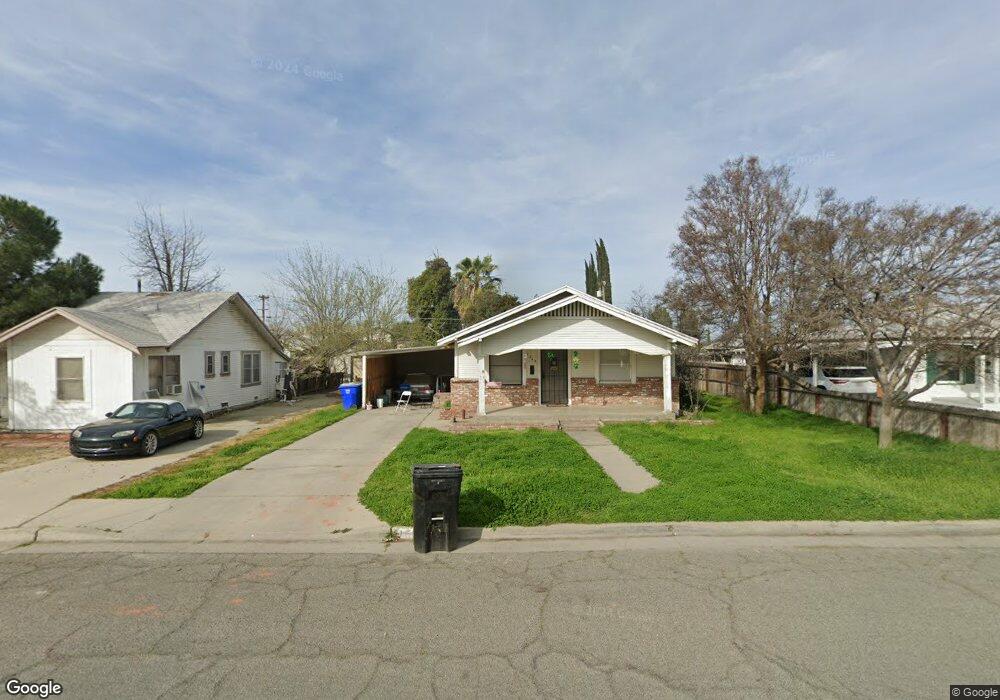
1508 Chittenden Ave Corcoran, CA 93212
Estimated Value: $195,000 - $246,000
3
Beds
1
Bath
1,128
Sq Ft
$198/Sq Ft
Est. Value
About This Home
This home is located at 1508 Chittenden Ave, Corcoran, CA 93212 and is currently estimated at $223,385, approximately $198 per square foot. 1508 Chittenden Ave is a home located in Kings County with nearby schools including Bret Harte Elementary School, Mark Twain Elementary School, and John C. Fremont Elementary School.
Ownership History
Date
Name
Owned For
Owner Type
Purchase Details
Closed on
Aug 27, 2019
Sold by
Alexander Shannon Shawn and Alexander Donna K
Bought by
Alexander Shannon Shawn and Alexander Donna K
Current Estimated Value
Purchase Details
Closed on
Sep 17, 2018
Sold by
Bill Heck
Bought by
Alexander Shannon L and Alexander Donna K
Purchase Details
Closed on
Nov 12, 2014
Sold by
Heck Bill
Bought by
Heck Bill and Maslowski Peggy
Purchase Details
Closed on
Jul 27, 2006
Sold by
Bella Teri
Bought by
Heck Bill and Heck Jack
Create a Home Valuation Report for This Property
The Home Valuation Report is an in-depth analysis detailing your home's value as well as a comparison with similar homes in the area
Purchase History
| Date | Buyer | Sale Price | Title Company |
|---|---|---|---|
| Alexander Shannon Shawn | -- | None Available | |
| Alexander Shannon L | $75,000 | Stewart Title | |
| Heck Bill | -- | None Available | |
| Heck Bill | $15,000 | None Available |
Source: Public Records
Tax History
| Year | Tax Paid | Tax Assessment Tax Assessment Total Assessment is a certain percentage of the fair market value that is determined by local assessors to be the total taxable value of land and additions on the property. | Land | Improvement |
|---|---|---|---|---|
| 2025 | $1,428 | $134,972 | $44,618 | $90,354 |
| 2023 | $1,401 | $129,734 | $42,887 | $86,847 |
| 2022 | $1,356 | $127,192 | $42,047 | $85,145 |
| 2021 | $1,330 | $124,699 | $41,223 | $83,476 |
| 2020 | $1,307 | $123,420 | $40,800 | $82,620 |
| 2019 | $1,452 | $121,000 | $40,000 | $81,000 |
| 2018 | $866 | $73,652 | $22,662 | $50,990 |
| 2017 | $848 | $72,208 | $22,218 | $49,990 |
| 2016 | $690 | $70,792 | $21,782 | $49,010 |
| 2015 | $687 | $69,729 | $21,455 | $48,274 |
| 2014 | $674 | $68,363 | $21,035 | $47,328 |
Source: Public Records
Map
Nearby Homes
- 1021 Stanley Ave
- 1633 Chase Ave
- 1701 Chase Ave
- 1036 Bainum Ave
- 1015 Hall Ave
- 817 Hall Ave
- 1121 Jepsen Ave
- 1317 Hall Ave
- 1801 Hale Ave
- 1926 Carnation Ct
- 1611 Letts Ave
- 1516 Jepsen Ave
- 916 Norboe Ave
- 1813 Josephine Ave
- 1016 Wigdal Ave
- 1500 Hanna Ave
- 1107 Patterson Ave
- 1508 Claire Ave
- 1225 Ottawa Ave
- 1530 Ottawa Ave
- 1514 Chittenden Ave
- 1506 Chittenden Ave
- 1506 S Chittenden
- 1504 Chittenden Ave
- 1520 Chittenden Ave
- 1509 Chase Ave
- 1505 Chase Ave
- 1515 Chase Ave
- 1509 Chittenden Ave
- 1002 Stanley Ave
- 1515 Chittenden Ave
- 1503 Chittenden Ave
- 1420 Chittenden Ave
- 1423 Chase Ave
- 1523 Chittenden Ave
- 1421 Chittenden Ave
- 1527 Chase Ave
- 1421 Chase Ave
- 1527 Chittenden Ave
- 1415 Chittenden Ave
Your Personal Tour Guide
Ask me questions while you tour the home.