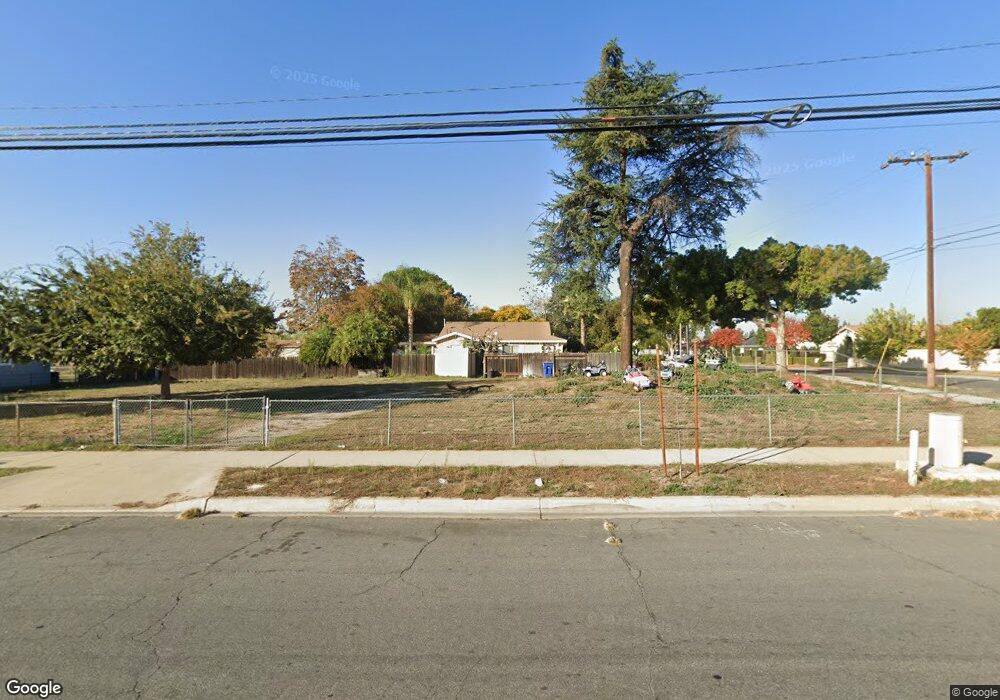
1508 S Fern Ave Ontario, CA 91762
Downtown Ontario NeighborhoodEstimated Value: $709,057 - $734,000
3
Beds
1
Bath
1,246
Sq Ft
$580/Sq Ft
Est. Value
About This Home
This home is located at 1508 S Fern Ave, Ontario, CA 91762 and is currently estimated at $722,514, approximately $579 per square foot. 1508 S Fern Ave is a home located in San Bernardino County with nearby schools including Richard Haynes Elementary, Oaks Middle, and Ontario High School.
Ownership History
Date
Name
Owned For
Owner Type
Purchase Details
Closed on
Dec 3, 2009
Sold by
Moody Jeffrey Brian
Bought by
Vazquez Jaime and Gonzalez Laura
Current Estimated Value
Home Financials for this Owner
Home Financials are based on the most recent Mortgage that was taken out on this home.
Original Mortgage
$269,037
Interest Rate
5.25%
Mortgage Type
FHA
Purchase Details
Closed on
Jun 21, 2005
Sold by
White William C
Bought by
Moody Jeffrey Brian and Moody Fawn Candice
Home Financials for this Owner
Home Financials are based on the most recent Mortgage that was taken out on this home.
Original Mortgage
$220,000
Interest Rate
1%
Mortgage Type
Negative Amortization
Purchase Details
Closed on
Jul 25, 2001
Sold by
White William C
Bought by
White William C
Home Financials for this Owner
Home Financials are based on the most recent Mortgage that was taken out on this home.
Original Mortgage
$121,500
Interest Rate
7.09%
Purchase Details
Closed on
Mar 27, 2001
Sold by
White Bonnie L
Bought by
White William C
Create a Home Valuation Report for This Property
The Home Valuation Report is an in-depth analysis detailing your home's value as well as a comparison with similar homes in the area
Home Values in the Area
Average Home Value in this Area
Purchase History
| Date | Buyer | Sale Price | Title Company |
|---|---|---|---|
| Vazquez Jaime | $274,000 | Orange Coast Title Co | |
| Moody Jeffrey Brian | $350,000 | -- | |
| White William C | -- | Fidelity National Title Co | |
| White William C | -- | -- |
Source: Public Records
Mortgage History
| Date | Status | Borrower | Loan Amount |
|---|---|---|---|
| Previous Owner | Vazquez Jaime | $269,037 | |
| Previous Owner | Moody Jeffrey Brian | $220,000 | |
| Previous Owner | White William C | $121,500 | |
| Closed | White William C | $45,000 |
Source: Public Records
Tax History Compared to Growth
Tax History
| Year | Tax Paid | Tax Assessment Tax Assessment Total Assessment is a certain percentage of the fair market value that is determined by local assessors to be the total taxable value of land and additions on the property. | Land | Improvement |
|---|---|---|---|---|
| 2025 | $3,731 | $353,687 | $123,789 | $229,898 |
| 2024 | $3,731 | $346,752 | $121,362 | $225,390 |
| 2023 | $3,624 | $339,953 | $118,982 | $220,971 |
| 2022 | $3,575 | $333,287 | $116,649 | $216,638 |
| 2021 | $3,551 | $326,752 | $114,362 | $212,390 |
| 2020 | $3,488 | $323,401 | $113,189 | $210,212 |
| 2019 | $3,457 | $317,060 | $110,970 | $206,090 |
| 2018 | $3,408 | $310,843 | $108,794 | $202,049 |
| 2017 | $3,284 | $304,748 | $106,661 | $198,087 |
| 2016 | $3,153 | $298,773 | $104,570 | $194,203 |
| 2015 | $3,131 | $294,285 | $102,999 | $191,286 |
| 2014 | $3,032 | $288,520 | $100,981 | $187,539 |
Source: Public Records
Map
Nearby Homes
- 4251 S Grasly Paseo
- 1420 S Euclid Ave Unit A & B
- 1546 Redwood Ave
- 559 W Belmont St
- 550 W Belmont St
- 653 W Belmont St
- 646 W Belmont St
- 1849 S San Antonio Ave
- 1620 S Cypress Ave
- 410 W Maitland St
- 1540 S Pleasant Ave
- 1949 S Palm Place
- 1343 S Sultana Ave
- 754 W Belmont St
- 1214 S Sultana Ave
- 1214 S Cypress Ave Unit G
- 1216 S Cypress Ave Unit E
- 718 S Vine Ave Unit A
- 2022 S San Antonio Ave
- 1650 S Campus Ave Unit 21