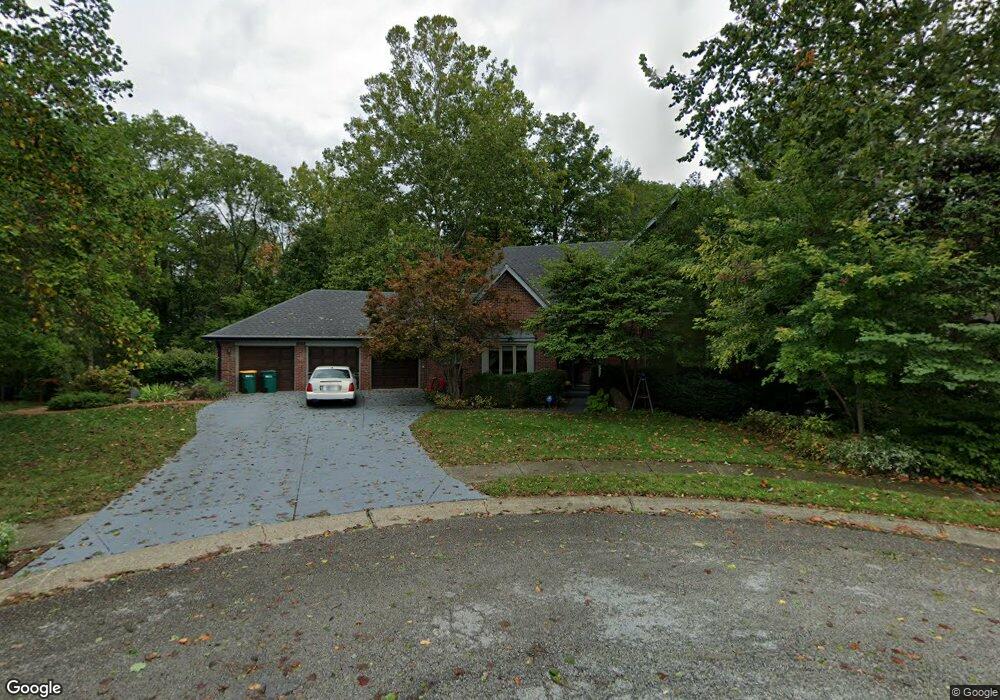
1508 Wildwood Ct Plainfield, IN 46168
Estimated Value: $450,000 - $485,514
4
Beds
4
Baths
3,930
Sq Ft
$119/Sq Ft
Est. Value
About This Home
This home is located at 1508 Wildwood Ct, Plainfield, IN 46168 and is currently estimated at $467,629, approximately $118 per square foot. 1508 Wildwood Ct is a home located in Hendricks County with nearby schools including Van Buren Elementary School, Plainfield Community Middle School, and Plainfield High School.
Ownership History
Date
Name
Owned For
Owner Type
Purchase Details
Closed on
Jul 30, 2009
Sold by
Davisson John and Davisson Olga
Bought by
Bowman Michael D and Bowman Janet M
Current Estimated Value
Home Financials for this Owner
Home Financials are based on the most recent Mortgage that was taken out on this home.
Original Mortgage
$150,000
Outstanding Balance
$99,188
Interest Rate
5.49%
Mortgage Type
New Conventional
Estimated Equity
$368,441
Purchase Details
Closed on
Sep 3, 2008
Sold by
Davisson John
Bought by
Dvisson John and Dvisson Olga
Purchase Details
Closed on
Aug 29, 2005
Sold by
Phelps Fredric W and Phelps Barbara J
Bought by
Davisson John W
Home Financials for this Owner
Home Financials are based on the most recent Mortgage that was taken out on this home.
Original Mortgage
$213,000
Interest Rate
5%
Mortgage Type
Adjustable Rate Mortgage/ARM
Create a Home Valuation Report for This Property
The Home Valuation Report is an in-depth analysis detailing your home's value as well as a comparison with similar homes in the area
Home Values in the Area
Average Home Value in this Area
Purchase History
| Date | Buyer | Sale Price | Title Company |
|---|---|---|---|
| Bowman Michael D | -- | Ctic | |
| Dvisson John | -- | None Available | |
| Davisson John W | -- | None Available |
Source: Public Records
Mortgage History
| Date | Status | Borrower | Loan Amount |
|---|---|---|---|
| Open | Bowman Michael D | $150,000 | |
| Previous Owner | Davisson John W | $213,000 |
Source: Public Records
Tax History Compared to Growth
Tax History
| Year | Tax Paid | Tax Assessment Tax Assessment Total Assessment is a certain percentage of the fair market value that is determined by local assessors to be the total taxable value of land and additions on the property. | Land | Improvement |
|---|---|---|---|---|
| 2024 | $5,102 | $510,200 | $26,500 | $483,700 |
| 2023 | $4,901 | $486,100 | $25,300 | $460,800 |
| 2022 | $4,662 | $468,200 | $16,200 | $452,000 |
| 2021 | $4,045 | $406,500 | $15,300 | $391,200 |
| 2020 | $4,280 | $428,000 | $35,500 | $392,500 |
| 2019 | $3,901 | $390,100 | $32,200 | $357,900 |
| 2018 | $3,901 | $390,100 | $32,200 | $357,900 |
| 2017 | $3,397 | $339,700 | $31,200 | $308,500 |
| 2016 | $3,262 | $326,200 | $31,200 | $295,000 |
| 2014 | $3,113 | $311,300 | $30,100 | $281,200 |
Source: Public Records
Map
Nearby Homes
- 904 Brendon Dr
- 1713 Sycamore Dr
- 800 Walton Dr
- 1220 American Ave
- 1219 Independence Blvd
- 1117 Valley View Dr
- 645 Masten St
- 628 Gibbs Ct
- 210 Kentucky Ave
- 60 Pike Place
- 59 Elm Dr
- 4423 Bridgefield Dr W
- 2394 Eagle Ave
- 2198 Galleone Way
- 550 548 S Center St
- 1771 Quaker Blvd
- 309 Duffey St
- 1836 Crystal Bay East Dr
- 327 S Mill St
- 416 Linden Ln
- 1512 Wildwood Ct
- 1507 Wildwood Ct
- 1516 Wildwood Ct
- 1500 Wildwood Ct
- 1505 Wildwood Ct
- 1623 Stafford Rd
- 1520 Wildwood Ct
- 920 Johnathan Dr
- 839 Wayside Dr
- 855 Wayside Dr
- 1609 Stafford Rd
- 1524 Wildwood Ct
- 916 Jonathan Dr
- 1605 Stafford Rd
- 923 Johnathan Dr
- 916 Johnathan Dr
- 827 Wayside Dr
- 1611 Stafford Rd
- 908 Creekside Ln
- 927 Johnathan Dr