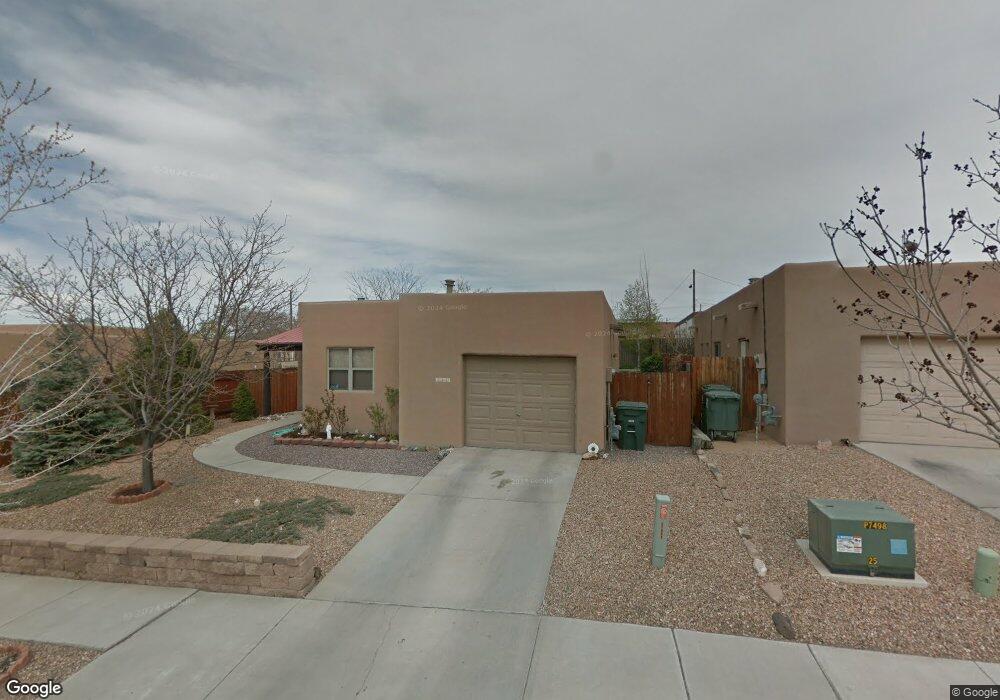
1509 La Cieneguita Santa Fe, NM 87507
Estimated Value: $357,000 - $442,000
2
Beds
2
Baths
1,041
Sq Ft
$382/Sq Ft
Est. Value
About This Home
This home is located at 1509 La Cieneguita, Santa Fe, NM 87507 and is currently estimated at $397,895, approximately $382 per square foot. 1509 La Cieneguita is a home located in Santa Fe County with nearby schools including Salazar Elementary School, Milagro Middle School, and Santa Fe High School.
Ownership History
Date
Name
Owned For
Owner Type
Purchase Details
Closed on
Sep 1, 2004
Sold by
Lopas Robert B and Contreras Lopas Betty J
Bought by
Farrand Lisa
Current Estimated Value
Home Financials for this Owner
Home Financials are based on the most recent Mortgage that was taken out on this home.
Original Mortgage
$50,000
Outstanding Balance
$27,397
Interest Rate
7.5%
Mortgage Type
New Conventional
Estimated Equity
$370,498
Purchase Details
Closed on
Apr 25, 2003
Sold by
Lopas Robert B
Bought by
Lopas Robert B and Contreras Lopas Betty J
Home Financials for this Owner
Home Financials are based on the most recent Mortgage that was taken out on this home.
Original Mortgage
$97,080
Interest Rate
5.8%
Mortgage Type
Purchase Money Mortgage
Purchase Details
Closed on
Jan 27, 1999
Sold by
Santa Fe Community Housing Trust
Bought by
Lopas Robert B
Create a Home Valuation Report for This Property
The Home Valuation Report is an in-depth analysis detailing your home's value as well as a comparison with similar homes in the area
Home Values in the Area
Average Home Value in this Area
Purchase History
| Date | Buyer | Sale Price | Title Company |
|---|---|---|---|
| Farrand Lisa | -- | Rio Grande Title Company Of | |
| Lopas Robert B | -- | -- | |
| Lopas Robert B | -- | -- |
Source: Public Records
Mortgage History
| Date | Status | Borrower | Loan Amount |
|---|---|---|---|
| Open | Farrand Lisa | $50,000 | |
| Previous Owner | Lopas Robert B | $97,080 |
Source: Public Records
Tax History Compared to Growth
Tax History
| Year | Tax Paid | Tax Assessment Tax Assessment Total Assessment is a certain percentage of the fair market value that is determined by local assessors to be the total taxable value of land and additions on the property. | Land | Improvement |
|---|---|---|---|---|
| 2024 | $1,411 | $185,143 | $65,670 | $119,473 |
| 2023 | $1,411 | $179,752 | $63,758 | $115,994 |
| 2022 | $1,380 | $174,517 | $61,901 | $112,616 |
| 2021 | $1,358 | $56,478 | $20,032 | $36,446 |
| 2020 | $1,318 | $54,834 | $19,449 | $35,385 |
| 2019 | $1,299 | $53,237 | $18,883 | $34,354 |
| 2018 | $1,271 | $51,687 | $18,333 | $33,354 |
| 2017 | $1,239 | $50,181 | $18,333 | $31,848 |
| 2016 | $1,168 | $48,720 | $18,333 | $30,387 |
| 2015 | $1,141 | $47,301 | $18,333 | $28,968 |
| 2014 | $1,073 | $45,877 | $18,315 | $27,562 |
Source: Public Records
Map
Nearby Homes
- 1534 Calle Angelina
- 1113 Paseo Corazon Unit 203
- 2804 Isaiah Ln
- 944 Camino Oraibi
- 1268 Maez Rd
- 1141 Harrison Rd
- 2239 Vuelta San Marcos
- 1304 Montoya Place
- 2504 Rosina St
- 1222 Vitalia St
- 1170 Harrison Rd
- 1176 Harrison Rd
- 965 Osage Ave
- 1950 San Ildefonso Rd
- 1407 Borrego Pass
- 500 Camino Solano
- 2200 W Alameda St
- 947 & 949 Acequia de Las Joyas
- 506 Barela Ln
- 960 Acequia de Las Joyas
- 1513 La Cieneguita
- 1505 La Cieneguita
- 1128 Maez Rd
- 1517 La Cieneguita
- 1501 La Cieneguita
- 1144 Maez Rd
- 1512 La Cieneguita
- 1116 Maez Rd
- 1504 La Cieneguita
- 1521 La Cieneguita
- 1520 La Cieneguita
- 1123 Maez Rd
- 1112 Maez Rd
- 1525 La Cieneguita
- 1507 Calle Angelina
- 1503 Calle Angelina
- 1511 Calle Angelina
- 1524 La Cieneguita
- 1121 Maez Rd
- 1515 Calle Angelina