1509 Le Roy Ave Berkeley, CA 94708
Berkeley Hills NeighborhoodEstimated Value: $1,775,000 - $3,115,000
5
Beds
3
Baths
3,202
Sq Ft
$687/Sq Ft
Est. Value
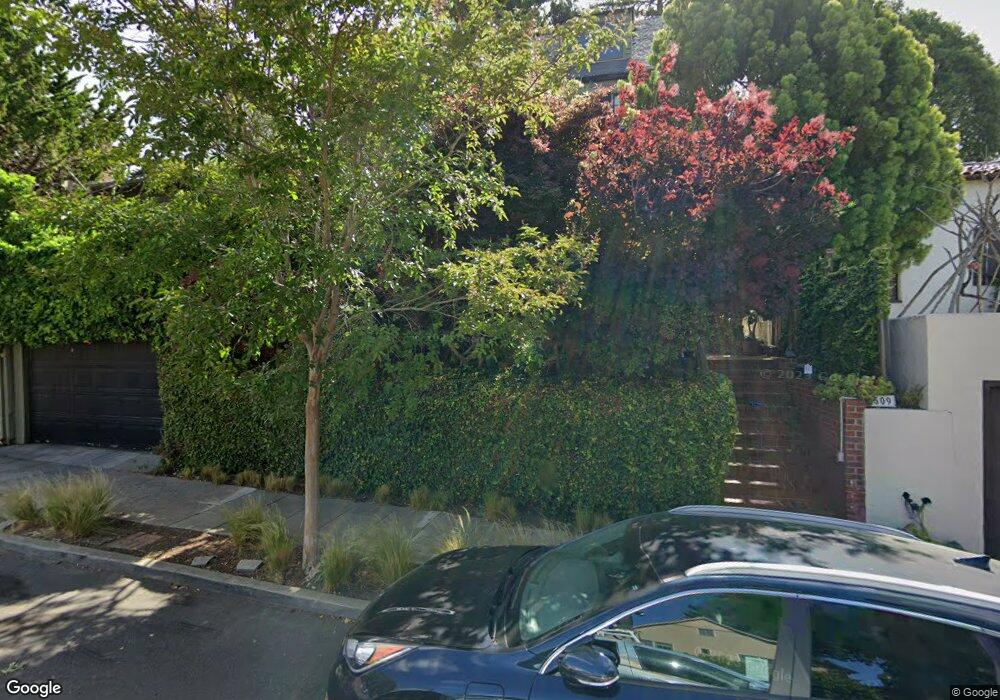
About This Home
This home is located at 1509 Le Roy Ave, Berkeley, CA 94708 and is currently estimated at $2,198,304, approximately $686 per square foot. 1509 Le Roy Ave is a home located in Alameda County with nearby schools including Berkeley Arts Magnet at Whittier School, Cragmont Elementary School, and Washington Elementary School.
Ownership History
Date
Name
Owned For
Owner Type
Purchase Details
Closed on
Mar 14, 2017
Sold by
Beaudry Peter Bohl
Bought by
Johnson Mary Reed
Current Estimated Value
Purchase Details
Closed on
Jan 3, 2003
Sold by
Bank Michael S and Bank Adrianne
Bought by
Bank Michael S and Bank Adrianne
Home Financials for this Owner
Home Financials are based on the most recent Mortgage that was taken out on this home.
Original Mortgage
$235,000
Outstanding Balance
$93,658
Interest Rate
5.12%
Estimated Equity
$2,104,646
Purchase Details
Closed on
Aug 16, 1999
Sold by
Pickus Robert and Pickus Sara
Bought by
Bank Michael S and Bank Adrianne
Home Financials for this Owner
Home Financials are based on the most recent Mortgage that was taken out on this home.
Original Mortgage
$240,000
Interest Rate
7.12%
Purchase Details
Closed on
Nov 23, 1994
Sold by
Pickus Robert and Pickus Sara
Bought by
Pickus Robert and Pickus Sara
Create a Home Valuation Report for This Property
The Home Valuation Report is an in-depth analysis detailing your home's value as well as a comparison with similar homes in the area
Home Values in the Area
Average Home Value in this Area
Purchase History
| Date | Buyer | Sale Price | Title Company |
|---|---|---|---|
| Johnson Mary Reed | -- | None Available | |
| Bank Michael S | -- | Placer Title Company | |
| Bank Michael S | -- | Placer Title Company | |
| Bank Michael S | $660,000 | Placer Title Company | |
| Pickus Robert | -- | -- |
Source: Public Records
Mortgage History
| Date | Status | Borrower | Loan Amount |
|---|---|---|---|
| Open | Bank Michael S | $235,000 | |
| Closed | Bank Michael S | $240,000 |
Source: Public Records
Tax History
| Year | Tax Paid | Tax Assessment Tax Assessment Total Assessment is a certain percentage of the fair market value that is determined by local assessors to be the total taxable value of land and additions on the property. | Land | Improvement |
|---|---|---|---|---|
| 2025 | $7,269 | $200,128 | $76,659 | $130,469 |
| 2024 | $7,269 | $196,068 | $75,156 | $127,912 |
| 2023 | $7,070 | $199,087 | $73,683 | $125,404 |
| 2022 | $6,837 | $188,185 | $72,239 | $122,946 |
| 2021 | $6,786 | $184,357 | $70,822 | $120,535 |
| 2020 | $6,158 | $189,395 | $70,096 | $119,299 |
| 2019 | $5,630 | $185,683 | $68,722 | $116,961 |
| 2018 | $5,472 | $182,043 | $67,375 | $114,668 |
| 2017 | $5,254 | $178,474 | $66,054 | $112,420 |
| 2016 | $4,894 | $174,975 | $64,759 | $110,216 |
| 2015 | $4,798 | $172,346 | $63,786 | $108,560 |
| 2014 | $4,641 | $168,971 | $62,537 | $106,434 |
Source: Public Records
Map
Nearby Homes
- 1471 Scenic Ave
- 2600 Hilgard Ave
- 2634 Virginia St Unit 13
- 2451 Le Conte Ave
- 2700 Le Conte Ave Unit 301
- 2700 Le Conte Ave Unit 402
- 2340 Virginia St
- 1136 Keith Ave
- 1444 Walnut St
- 2201 Virginia St Unit 2
- 0 Queens Rd Unit ML82024219
- 1375 Queens Rd
- 1440 Walnut St Unit 5
- 1165 Cragmont Ave
- 1106 Cragmont Ave
- 1110 Sterling Ave
- 2012 Rose St
- 120 Hill Rd
- 1468 Summit Rd
- 1610 Milvia St
- 1505 Le Roy Ave
- 1517 Le Roy Ave
- 0 Le Roy Unit 40755477
- 0 Le Roy Unit 41018993
- 0 Le Roy Unit 40867624
- 1501 Le Roy Ave
- 1521 Le Roy Ave
- 2577 Buena Vista Way
- 2573 Buena Vista Way
- 2587 Buena Vista Way
- 2545 Buena Vista Way
- 2565 Buena Vista Way
- 2535 Buena Vista Way
- 1497 Le Roy Ave
- 2593 Buena Vista Way
- 1508 Le Roy Ave
- 1514 Le Roy Ave
- 2555 Buena Vista Way
- 1504 Le Roy Ave
- 1516 Le Roy Ave
Your Personal Tour Guide
Ask me questions while you tour the home.