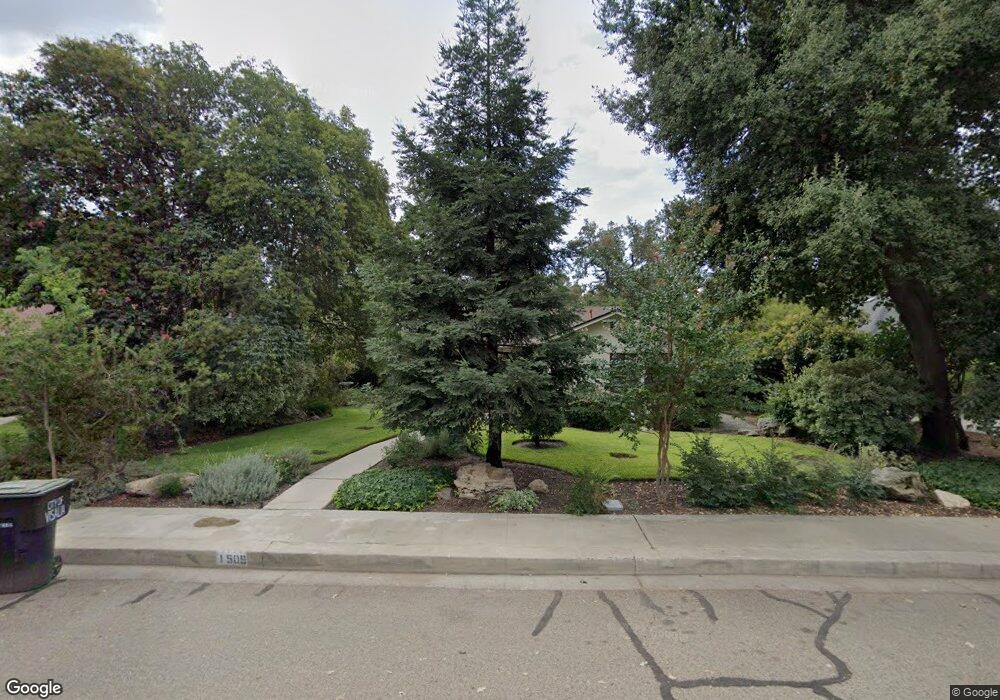
1509 W College Ave Visalia, CA 93277
South Visalia NeighborhoodEstimated Value: $370,385 - $404,000
2
Beds
2
Baths
1,431
Sq Ft
$273/Sq Ft
Est. Value
About This Home
This home is located at 1509 W College Ave, Visalia, CA 93277 and is currently estimated at $391,096, approximately $273 per square foot. 1509 W College Ave is a home located in Tulare County with nearby schools including Divisadero Middle School, Mt. Whitney High School, and Visalia Charter Independent Study - East Campus.
Ownership History
Date
Name
Owned For
Owner Type
Purchase Details
Closed on
Mar 20, 2009
Sold by
Bank Of New York
Bought by
Harvey Steve R and Harvey Jeanne L
Current Estimated Value
Home Financials for this Owner
Home Financials are based on the most recent Mortgage that was taken out on this home.
Original Mortgage
$117,800
Outstanding Balance
$74,467
Interest Rate
5.02%
Mortgage Type
Purchase Money Mortgage
Estimated Equity
$316,629
Purchase Details
Closed on
Jun 30, 2008
Sold by
Erickson Craig A
Bought by
Bank Of New York and Cwabs Inc Asset Backed Certificates Seri
Purchase Details
Closed on
Apr 9, 1999
Sold by
Kirishian Jeffrey W
Bought by
Erickson Craig A and Erickson Carolyn M
Home Financials for this Owner
Home Financials are based on the most recent Mortgage that was taken out on this home.
Original Mortgage
$101,500
Interest Rate
6.84%
Mortgage Type
Seller Take Back
Create a Home Valuation Report for This Property
The Home Valuation Report is an in-depth analysis detailing your home's value as well as a comparison with similar homes in the area
Home Values in the Area
Average Home Value in this Area
Purchase History
| Date | Buyer | Sale Price | Title Company |
|---|---|---|---|
| Harvey Steve R | $131,000 | First American Title Company | |
| Bank Of New York | $140,250 | Landsafe Title | |
| Erickson Craig A | $86,500 | Chicago Title Co |
Source: Public Records
Mortgage History
| Date | Status | Borrower | Loan Amount |
|---|---|---|---|
| Open | Harvey Steve R | $117,800 | |
| Previous Owner | Erickson Craig A | $101,500 |
Source: Public Records
Tax History Compared to Growth
Tax History
| Year | Tax Paid | Tax Assessment Tax Assessment Total Assessment is a certain percentage of the fair market value that is determined by local assessors to be the total taxable value of land and additions on the property. | Land | Improvement |
|---|---|---|---|---|
| 2025 | $1,708 | $168,694 | $45,072 | $123,622 |
| 2024 | $1,708 | $165,388 | $44,189 | $121,199 |
| 2023 | $1,660 | $162,146 | $43,323 | $118,823 |
| 2022 | $1,584 | $158,968 | $42,474 | $116,494 |
| 2021 | $1,585 | $155,851 | $41,641 | $114,210 |
| 2020 | $1,568 | $154,253 | $41,214 | $113,039 |
| 2019 | $1,525 | $151,229 | $40,406 | $110,823 |
| 2018 | $1,482 | $148,264 | $39,614 | $108,650 |
| 2017 | $1,468 | $145,357 | $38,837 | $106,520 |
| 2016 | $1,436 | $142,506 | $38,075 | $104,431 |
| 2015 | $1,393 | $140,365 | $37,503 | $102,862 |
| 2014 | $1,393 | $137,615 | $36,768 | $100,847 |
Source: Public Records
Map
Nearby Homes
- 621 S Divisadero St
- 1301 W Beverly Dr
- 1107 W Westcott Ave
- 602 S Conyer St
- 1421 W Oak Ave
- 1321 W Oak Ave
- 1315 S Conyer St
- 1608 S Central St
- 1640 W Princeton Ct
- 1406 W Princeton Ave
- 1419 S Crowe St
- 313 N Giddings St
- 526 W Myrtle Ave
- 733 W Paradise Ave
- 2419 W Harvard Ave
- 1330 S Clover St
- 704 N Divisadero St
- 1103 S Linda Vista St
- 2013 S Giddings St
- 542 W Paradise Ave
- 1505 W College Ave
- 1501 W College Ave
- 1516 W Beverly Dr
- 1500 W Beverly Dr
- 1508 W College Ave
- 1504 W College Ave
- 1512 W College Ave
- 1500 W College Ave
- 1514 W College Ave
- 1419 W College Ave
- 1520 W Beverly Dr
- 1516 W College Ave
- 1513 W Beverly Dr
- 1509 W Beverly Dr
- 1517 W Beverly Dr
- 1420 W College Ave
- 1505 W Beverly Dr
- 1518 W College Ave
- 1415 W College Ave
- 1503 W Myrtle Ave