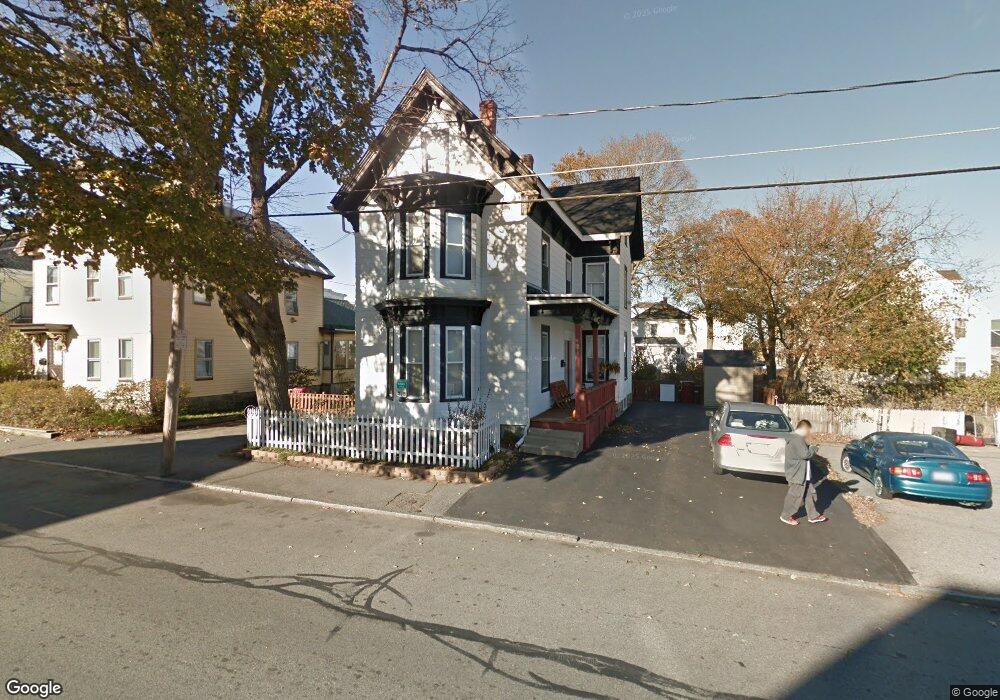
151 Branch St Lowell, MA 01851
Lower Highlands NeighborhoodEstimated Value: $467,000 - $623,000
5
Beds
2
Baths
2,230
Sq Ft
$242/Sq Ft
Est. Value
About This Home
This home is located at 151 Branch St, Lowell, MA 01851 and is currently estimated at $540,106, approximately $242 per square foot. 151 Branch St is a home located in Middlesex County with nearby schools including Charles W. Morey Elementary School, Abraham Lincoln Elementary School, and Charlotte M. Murkland Elementary School.
Ownership History
Date
Name
Owned For
Owner Type
Purchase Details
Closed on
Apr 22, 2016
Sold by
Lam Sophie and Lam Mom
Bought by
Lam Sophie
Current Estimated Value
Purchase Details
Closed on
Nov 9, 2010
Sold by
Mccann William P
Bought by
Lam Sophie and Lam Mom
Home Financials for this Owner
Home Financials are based on the most recent Mortgage that was taken out on this home.
Original Mortgage
$222,997
Interest Rate
4.25%
Mortgage Type
FHA
Purchase Details
Closed on
Jan 29, 2010
Sold by
Us Bk
Bought by
Mccann William P
Purchase Details
Closed on
Oct 9, 2009
Sold by
Saing Janet Hun and Us Bk
Bought by
Us Bk
Purchase Details
Closed on
Aug 28, 2006
Sold by
Hun Janet and Saing Peter Hun
Bought by
Saing Janet Hun
Purchase Details
Closed on
Jun 28, 2004
Sold by
Saing Janet Hun and Saing Sichan Hu
Bought by
Hun Janet and Saing Peter Hun
Purchase Details
Closed on
Aug 31, 1999
Sold by
Priest Thomas N
Bought by
Saing Sichan Hun
Purchase Details
Closed on
Jun 23, 1993
Sold by
Priest John M
Bought by
Priest Thomas N
Create a Home Valuation Report for This Property
The Home Valuation Report is an in-depth analysis detailing your home's value as well as a comparison with similar homes in the area
Home Values in the Area
Average Home Value in this Area
Purchase History
| Date | Buyer | Sale Price | Title Company |
|---|---|---|---|
| Lam Sophie | -- | -- | |
| Lam Sophie | -- | -- | |
| Lam Sophie | $226,000 | -- | |
| Lam Sophie | $226,000 | -- | |
| Mccann William P | $130,000 | -- | |
| Mccann William P | $130,000 | -- | |
| Us Bk | $145,483 | -- | |
| Us Bk | $145,483 | -- | |
| Saing Janet Hun | -- | -- | |
| Saing Janet Hun | -- | -- | |
| Saing Janet Hun | -- | -- | |
| Hun Janet | -- | -- | |
| Hun Janet | -- | -- | |
| Saing Sichan Hun | $122,000 | -- | |
| Saing Sichan Hun | $122,000 | -- | |
| Priest Thomas N | $20,000 | -- | |
| Priest Thomas N | $20,000 | -- |
Source: Public Records
Mortgage History
| Date | Status | Borrower | Loan Amount |
|---|---|---|---|
| Open | Priest Thomas N | $25,300 | |
| Previous Owner | Lam Sophie | $222,997 |
Source: Public Records
Tax History Compared to Growth
Tax History
| Year | Tax Paid | Tax Assessment Tax Assessment Total Assessment is a certain percentage of the fair market value that is determined by local assessors to be the total taxable value of land and additions on the property. | Land | Improvement |
|---|---|---|---|---|
| 2025 | $5,801 | $505,300 | $153,900 | $351,400 |
| 2024 | $5,594 | $469,700 | $138,500 | $331,200 |
| 2023 | $5,281 | $425,200 | $120,400 | $304,800 |
| 2022 | $5,035 | $396,800 | $109,500 | $287,300 |
| 2021 | $4,700 | $349,200 | $95,200 | $254,000 |
| 2020 | $4,335 | $324,500 | $83,200 | $241,300 |
| 2019 | $4,164 | $296,600 | $77,000 | $219,600 |
| 2018 | $4,025 | $279,700 | $70,100 | $209,600 |
| 2017 | $3,840 | $257,400 | $63,700 | $193,700 |
| 2016 | $3,334 | $219,900 | $60,700 | $159,200 |
| 2015 | $3,243 | $209,500 | $62,100 | $147,400 |
| 2013 | $3,041 | $202,600 | $74,300 | $128,300 |
Source: Public Records
Map
Nearby Homes
- 145 Branch St
- 155 Branch St
- 143 Branch St Unit 2
- 152 Branch St
- 15 Walker Place
- 13 Walker Place
- 15 Walker Place Unit 15
- 135 Branch St
- 165 Branch St
- 16 Walker Place
- 14 Walker Place
- 7 Coral St
- 16 Maude St
- 129 Branch St
- 162 Branch St
- 8 Manahan St Unit 3,1
- 14 Smith Ave
- 24 Maude St
- 11 Coral St
- 11 Coral St Unit 1