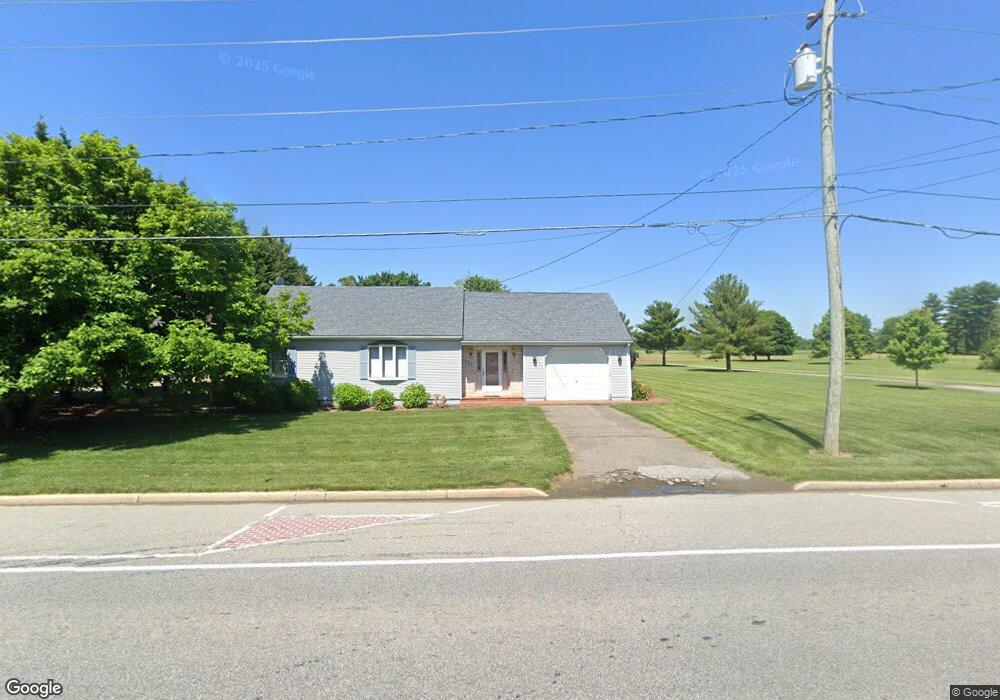
151 N Bohemia Ave Cecilton, MD 21913
Estimated Value: $284,000 - $344,000
--
Bed
--
Bath
1,418
Sq Ft
$219/Sq Ft
Est. Value
About This Home
This home is located at 151 N Bohemia Ave, Cecilton, MD 21913 and is currently estimated at $310,492, approximately $218 per square foot. 151 N Bohemia Ave is a home located in Cecil County with nearby schools including Cecilton Elementary School, Bohemia Manor Middle School, and Bohemia Manor High School.
Ownership History
Date
Name
Owned For
Owner Type
Purchase Details
Closed on
Jan 17, 2007
Sold by
Day Johnnie and Day Virginia
Bought by
Day John R
Current Estimated Value
Home Financials for this Owner
Home Financials are based on the most recent Mortgage that was taken out on this home.
Original Mortgage
$175,000
Outstanding Balance
$114,588
Interest Rate
8%
Mortgage Type
Purchase Money Mortgage
Estimated Equity
$195,904
Purchase Details
Closed on
Dec 19, 2006
Sold by
Day Johnnie and Day Virginia
Bought by
Day John R
Home Financials for this Owner
Home Financials are based on the most recent Mortgage that was taken out on this home.
Original Mortgage
$175,000
Outstanding Balance
$114,588
Interest Rate
8%
Mortgage Type
Purchase Money Mortgage
Estimated Equity
$195,904
Purchase Details
Closed on
Feb 21, 1985
Sold by
Beasten Albert H
Bought by
Day Johnnie and Day Virginia
Home Financials for this Owner
Home Financials are based on the most recent Mortgage that was taken out on this home.
Original Mortgage
$30,000
Interest Rate
12.9%
Purchase Details
Closed on
Aug 6, 1977
Sold by
Groves Kenneth Deane
Bought by
Beasten Albert H
Create a Home Valuation Report for This Property
The Home Valuation Report is an in-depth analysis detailing your home's value as well as a comparison with similar homes in the area
Home Values in the Area
Average Home Value in this Area
Purchase History
| Date | Buyer | Sale Price | Title Company |
|---|---|---|---|
| Day John R | $270,000 | -- | |
| Day John R | $270,000 | -- | |
| Day Johnnie | $55,000 | -- | |
| Beasten Albert H | $35,000 | -- |
Source: Public Records
Mortgage History
| Date | Status | Borrower | Loan Amount |
|---|---|---|---|
| Open | Day John R | $175,000 | |
| Closed | Day John R | $175,000 | |
| Previous Owner | Day Johnnie | $30,000 |
Source: Public Records
Tax History Compared to Growth
Tax History
| Year | Tax Paid | Tax Assessment Tax Assessment Total Assessment is a certain percentage of the fair market value that is determined by local assessors to be the total taxable value of land and additions on the property. | Land | Improvement |
|---|---|---|---|---|
| 2025 | $3,268 | $210,233 | $0 | $0 |
| 2024 | $2,770 | $200,600 | $77,000 | $123,600 |
| 2023 | $2,197 | $197,367 | $0 | $0 |
| 2022 | $2,896 | $194,133 | $0 | $0 |
| 2021 | $2,838 | $190,900 | $77,000 | $113,900 |
| 2020 | $5,624 | $185,933 | $0 | $0 |
| 2019 | $2,778 | $180,967 | $0 | $0 |
| 2018 | $2,718 | $176,000 | $81,000 | $95,000 |
| 2017 | $2,718 | $176,000 | $0 | $0 |
| 2016 | $2,804 | $176,000 | $0 | $0 |
| 2015 | $2,804 | $192,800 | $0 | $0 |
| 2014 | $2,867 | $192,800 | $0 | $0 |
Source: Public Records
Map
Nearby Homes
- 0 N Bohemia Ave
- 223 S Ariel Ave
- 0 Water St Unit MDCC2018060
- 0 Stump Ln Unit MDCC2019598
- 0 Mill Ln
- 189 Black Fish Ln Unit GLEN 4
- 168, 169 & 170 Nootka Ln
- 300 Mocanaqua Ln Unit GLEN 3
- 273 Hoonah Ln Unit GLEN 3
- 274,275 Hoonah Ln Unit GLEN 3
- 266 Laughing Water Ln Unit GLEN 3
- 0 Cecilton Warwick Rd Unit MDCC2018578
- 0 Cecilton Warwick Rd Unit MDCC2013494
- 20 Inka Ln Unit GLEN 3
- 10 Accokeek Ln Unit GLEN 3
- 92,91 Naomi Ln Unit GLEN 9
- 127,150 Naomi and Pucksinwah Lanes Unit GLEN 9
- 149 Pucksinwah Ln Unit GLEN 9
- 273,272 Teton Ln Unit GLEN 9
- 271 Teton Ln Unit GLEN 9
- 148 N Bohemia Ave
- 147 N Bohemia Ave
- 147 N Bohemia Ave
- 143 S Bohemia Ave
- 143 N Bohemia Ave
- 144 N Bohemia Ave
- 143 N Bohemia Ave
- 144 N Bohemia Ave
- 148 N Bohemia Ave
- 148 N Bohemia Ave
- 142 N Bohemia Ave
- 201 N Bohemia Ave
- 139 N Bohemia Ave
- 138 N Bohemia Ave
- 200 N Bohemia Ave
- 201 Ariel Ave
- 135 N Bohemia Ave
- 135 Bohemia Ave
- 205 N Bohemia Ave
- 201 Ariel Ave