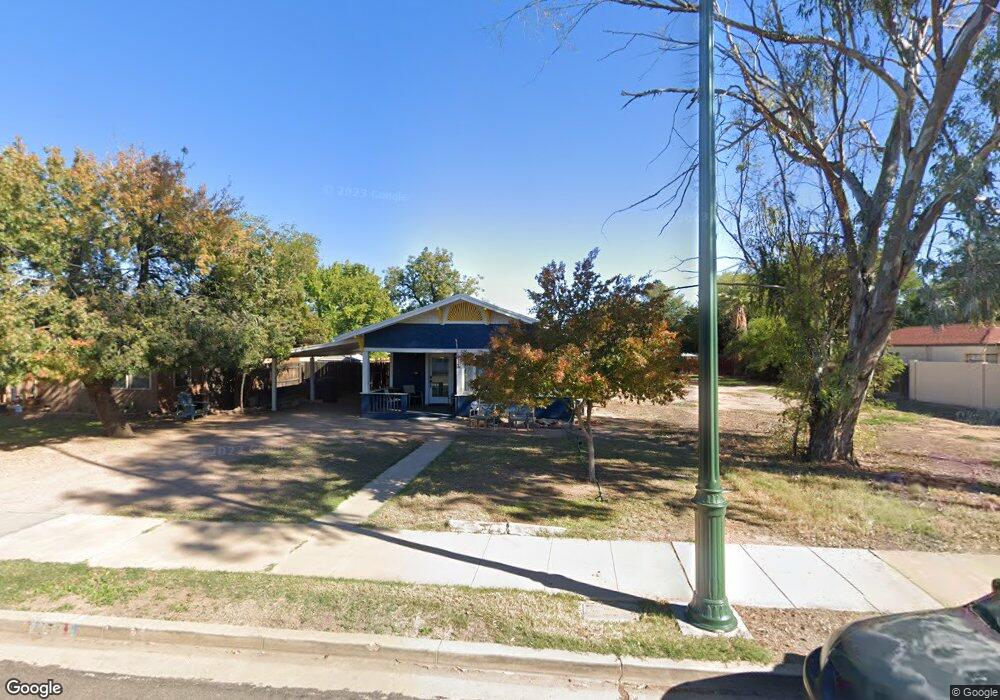
151 N Wilbur Mesa, AZ 85201
Downtown Mesa NeighborhoodEstimated Value: $297,000 - $370,000
Studio
--
Bath
1,052
Sq Ft
$314/Sq Ft
Est. Value
About This Home
This home is located at 151 N Wilbur, Mesa, AZ 85201 and is currently estimated at $330,489, approximately $314 per square foot. 151 N Wilbur is a home with nearby schools including Eisenhower Center for Innovation, Franklin at Brimhall Elementary School, and Franklin West Elementary School.
Ownership History
Date
Name
Owned For
Owner Type
Purchase Details
Closed on
Jun 4, 2007
Sold by
Curry Van and Lilley Tiffiny
Bought by
Cann David C
Current Estimated Value
Home Financials for this Owner
Home Financials are based on the most recent Mortgage that was taken out on this home.
Original Mortgage
$63,600
Interest Rate
6.14%
Mortgage Type
New Conventional
Purchase Details
Closed on
May 5, 2006
Sold by
Schrah Jeff and Schrah Shelly
Bought by
Curry Van and Lilley Tiffiny
Home Financials for this Owner
Home Financials are based on the most recent Mortgage that was taken out on this home.
Original Mortgage
$122,850
Interest Rate
1.4%
Mortgage Type
Negative Amortization
Purchase Details
Closed on
Jul 23, 1999
Sold by
Schrah John G and Schrah Charlotte
Bought by
Schrah Jeffery L and Schrah Shelly
Home Financials for this Owner
Home Financials are based on the most recent Mortgage that was taken out on this home.
Original Mortgage
$60,480
Interest Rate
7.64%
Create a Home Valuation Report for This Property
The Home Valuation Report is an in-depth analysis detailing your home's value as well as a comparison with similar homes in the area
Home Values in the Area
Average Home Value in this Area
Purchase History
We collect this data history from publicly available records. To have your information removed, we recommend requesting removal directly through your county’s website.
| Date | Buyer | Sale Price | Title Company |
|---|---|---|---|
| Cann David C | $79,500 | Premier Title Group Maricopa | |
| Curry Van | $175,500 | Premier Title Group Maricopa | |
| Schrah Jeffery L | -- | Capital Title Agency |
Source: Public Records
Mortgage History
We collect this data history from publicly available records. To have your information removed, we recommend requesting removal directly through your county’s website.
| Date | Status | Borrower | Loan Amount |
|---|---|---|---|
| Closed | Cann David C | $63,600 | |
| Previous Owner | Curry Van | $122,850 | |
| Previous Owner | Schrah Jeffery L | $60,480 |
Source: Public Records
Tax History
| Year | Tax Paid | Tax Assessment Tax Assessment Total Assessment is a certain percentage of the fair market value that is determined by local assessors to be the total taxable value of land and additions on the property. | Land | Improvement |
|---|---|---|---|---|
| 2025 | $698 | $7,074 | -- | -- |
| 2024 | $700 | $6,737 | -- | -- |
| 2023 | $700 | $21,420 | $4,280 | $17,140 |
| 2022 | $686 | $16,850 | $3,370 | $13,480 |
| 2021 | $694 | $13,660 | $2,730 | $10,930 |
| 2020 | $685 | $11,960 | $2,390 | $9,570 |
| 2019 | $640 | $9,680 | $1,930 | $7,750 |
| 2018 | $614 | $8,970 | $1,790 | $7,180 |
| 2017 | $596 | $7,610 | $1,520 | $6,090 |
| 2016 | $585 | $5,700 | $1,140 | $4,560 |
| 2015 | $550 | $5,580 | $1,110 | $4,470 |
Source: Public Records
Map
Nearby Homes
- 61 N Hibbert
- 225 N Pomeroy Unit 6
- 225 N Pomeroy Unit 14
- 416 N Lewis
- 545 E University Dr
- 531 N Sirrine
- 46 W 2nd St
- 601 E University Dr
- 443 N Hobson Plaza
- 655 E 2nd St
- 41 W Main St
- 533 N Lesueur
- 505 N Hobson Plaza
- 629 N Mesa Dr Unit 16
- 629 N Mesa Dr Unit 27
- 629 N Mesa Dr Unit 35
- 612 N Lesueur Cir
- 707 E University Dr
- 556 N Hobson Plaza
- 126 W 3rd Place
- 150 N Wilbur
- 144 N Wilbur
- 154 N Wilbur
- 158 N Wilbur
- 132 N Wilbur
- 151 N Hibbert
- 223 E 2nd St Unit 223
- 223 E 2nd St Unit 225
- 223 E 2nd St
- 221 E 2nd St Unit A
- 221 E 2nd St
- 221 E 2nd St Unit B
- 128 N Hibbert
- 225 E 2nd St
- 128 N Wilbur
- 141 N Wilbur
- 137 N Wilbur
- 157 N Wilbur
- 145 N Wilbur Unit 36
- 133 N Wilbur
Your Personal Tour Guide
Ask me questions while you tour the home.