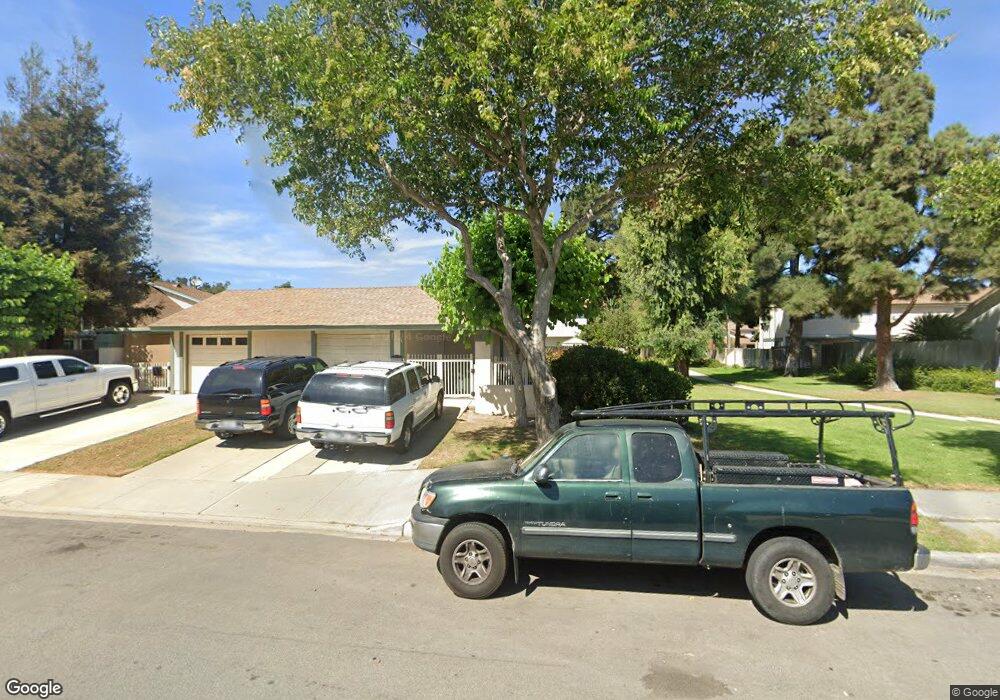
151 Ripley St Camarillo, CA 93010
Estimated Value: $588,000 - $685,000
3
Beds
2
Baths
960
Sq Ft
$649/Sq Ft
Est. Value
About This Home
This home is located at 151 Ripley St, Camarillo, CA 93010 and is currently estimated at $622,919, approximately $648 per square foot. 151 Ripley St is a home located in Ventura County with nearby schools including Las Posas Elementary School, Monte Vista Middle School, and Adolfo Camarillo High School.
Ownership History
Date
Name
Owned For
Owner Type
Purchase Details
Closed on
Jul 17, 2013
Sold by
Namba Rex T
Bought by
Namba Arliss A
Current Estimated Value
Home Financials for this Owner
Home Financials are based on the most recent Mortgage that was taken out on this home.
Original Mortgage
$138,300
Outstanding Balance
$31,248
Interest Rate
3.09%
Mortgage Type
New Conventional
Estimated Equity
$591,671
Purchase Details
Closed on
May 2, 2000
Sold by
Namba Carol
Bought by
Namba Rex T
Home Financials for this Owner
Home Financials are based on the most recent Mortgage that was taken out on this home.
Original Mortgage
$166,500
Interest Rate
8.22%
Purchase Details
Closed on
Sep 27, 1996
Sold by
Thomas Powrie Linda and Thomas Family Trust
Bought by
Leslie Jason Daniel and Leslie Desiree Andrea
Home Financials for this Owner
Home Financials are based on the most recent Mortgage that was taken out on this home.
Original Mortgage
$124,900
Interest Rate
8.14%
Mortgage Type
FHA
Create a Home Valuation Report for This Property
The Home Valuation Report is an in-depth analysis detailing your home's value as well as a comparison with similar homes in the area
Home Values in the Area
Average Home Value in this Area
Purchase History
| Date | Buyer | Sale Price | Title Company |
|---|---|---|---|
| Namba Arliss A | $55,500 | Chicago Title Company | |
| Namba Rex T | -- | First American Title Ins Co | |
| Namba Arliss A | $185,000 | First American Title Co | |
| Leslie Jason Daniel | $129,000 | Old Republic Title Company |
Source: Public Records
Mortgage History
| Date | Status | Borrower | Loan Amount |
|---|---|---|---|
| Open | Namba Arliss A | $138,300 | |
| Previous Owner | Namba Arliss A | $166,500 | |
| Previous Owner | Leslie Jason Daniel | $124,900 |
Source: Public Records
Tax History
| Year | Tax Paid | Tax Assessment Tax Assessment Total Assessment is a certain percentage of the fair market value that is determined by local assessors to be the total taxable value of land and additions on the property. | Land | Improvement |
|---|---|---|---|---|
| 2025 | $3,491 | $322,594 | $129,037 | $193,557 |
| 2024 | $3,491 | $316,269 | $126,507 | $189,762 |
| 2023 | $3,365 | $310,068 | $124,026 | $186,042 |
| 2022 | $3,353 | $303,989 | $121,594 | $182,395 |
| 2021 | $3,232 | $298,029 | $119,210 | $178,819 |
| 2020 | $3,219 | $294,976 | $117,989 | $176,987 |
| 2019 | $3,203 | $289,193 | $115,676 | $173,517 |
| 2018 | $3,143 | $283,523 | $113,408 | $170,115 |
| 2017 | $2,958 | $277,965 | $111,185 | $166,780 |
| 2016 | $2,886 | $272,515 | $109,005 | $163,510 |
| 2015 | $2,855 | $268,422 | $107,368 | $161,054 |
| 2014 | $2,787 | $263,166 | $105,266 | $157,900 |
Source: Public Records
Map
Nearby Homes
- 206 Camino Cortina
- 170 Sawbuck St
- 586 Pioneer St
- 179 Stonegate Rd
- 137 Calle Vista
- 813 N Calle Circulo
- 645 Corte Estrella
- 91 Calle Escalon
- 664 Corte Regalo
- 350 Serra St
- 427 La Marina Dr
- 85 Crestview Ave
- 275 Crestview Ave
- 15 Encino Ave
- 275 1/2 Crestview Ave
- 277 Crestview Ave
- 532 Corte Corrida
- 554 Corte Corrida
- 1075 Seybolt Ave
- 25 Encino Ave
- 153 Ripley St
- 155 Ripley St Unit 22
- 155 Ripley St
- 157 Ripley St
- 146 Green Glade Ct
- 148 Green Glade Ct
- 145 Ripley St
- 150 Green Glade Ct
- 143 Ripley St
- 152 Green Glade Ct Unit 16
- 152 Green Glade Ct
- 142 Tree Fern Ct Unit 42
- 159 Ripley St
- 140 Tree Fern Ct
- 161 Ripley St Unit 19
- 161 Ripley St
- 150 Ripley St
- 152 Ripley St
- 148 Ripley St Unit 4
- 154 Green Glade Ct
Your Personal Tour Guide
Ask me questions while you tour the home.