Estimated Value: $1,110,000 - $1,410,000
4
Beds
3
Baths
2,363
Sq Ft
$532/Sq Ft
Est. Value
About This Home
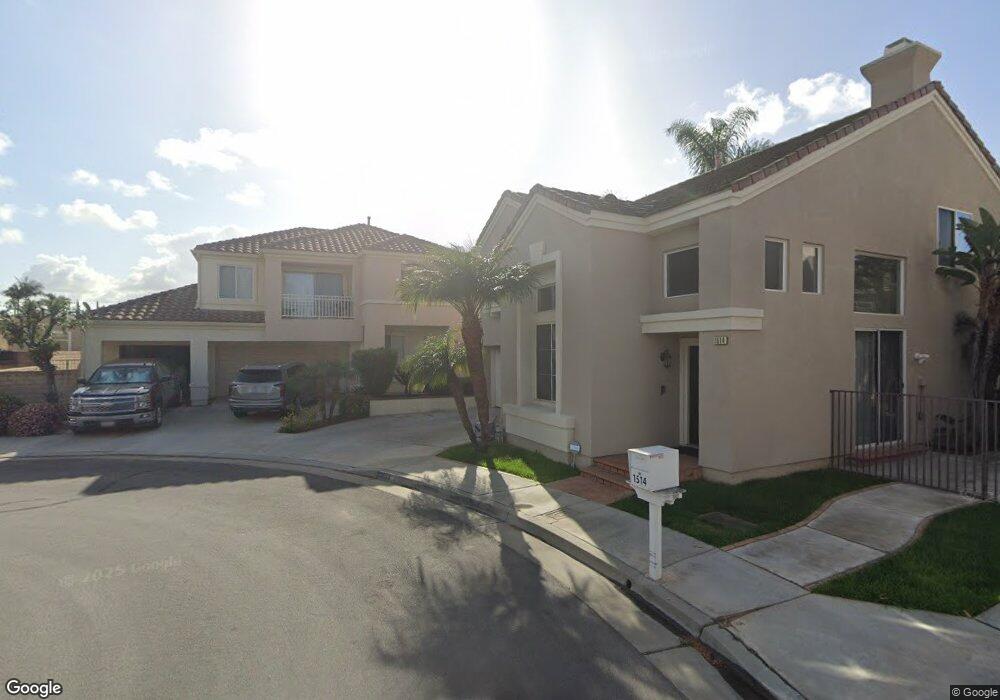
This home is located at 1510 Allyson Ct, Brea, CA 92821 and is currently estimated at $1,256,905, approximately $531 per square foot. 1510 Allyson Ct is a home located in Orange County with nearby schools including Ladera Palma Elementary School, Sierra Vista Elementary School, and Washington Middle School.
Ownership History
Date
Name
Owned For
Owner Type
Purchase Details
Closed on
Jul 2, 2018
Sold by
Calderon Edmund L and Calderon Eleanor M
Bought by
Calderon Edmund L and Calderon M
Current Estimated Value
Purchase Details
Closed on
Apr 30, 2001
Sold by
Mccoy David W and Mccoy Susan
Bought by
Calderon Edmund L and Calderon Eleanor M
Home Financials for this Owner
Home Financials are based on the most recent Mortgage that was taken out on this home.
Original Mortgage
$195,000
Outstanding Balance
$73,459
Interest Rate
7.15%
Estimated Equity
$1,183,446
Purchase Details
Closed on
Aug 14, 1996
Sold by
Brea Vista Partners
Bought by
Mccoy David W and Mccoy Susan
Home Financials for this Owner
Home Financials are based on the most recent Mortgage that was taken out on this home.
Original Mortgage
$220,800
Interest Rate
5.82%
Create a Home Valuation Report for This Property
The Home Valuation Report is an in-depth analysis detailing your home's value as well as a comparison with similar homes in the area
Home Values in the Area
Average Home Value in this Area
Purchase History
| Date | Buyer | Sale Price | Title Company |
|---|---|---|---|
| Calderon Edmund L | -- | None Available | |
| Calderon Edmund L | $390,000 | Southland Title Corporation | |
| Mccoy David W | $276,500 | First American Title Ins |
Source: Public Records
Mortgage History
| Date | Status | Borrower | Loan Amount |
|---|---|---|---|
| Open | Calderon Edmund L | $195,000 | |
| Previous Owner | Mccoy David W | $220,800 |
Source: Public Records
Tax History
| Year | Tax Paid | Tax Assessment Tax Assessment Total Assessment is a certain percentage of the fair market value that is determined by local assessors to be the total taxable value of land and additions on the property. | Land | Improvement |
|---|---|---|---|---|
| 2025 | $6,831 | $587,661 | $265,538 | $322,123 |
| 2024 | $6,831 | $576,139 | $260,332 | $315,807 |
| 2023 | $6,675 | $564,843 | $255,228 | $309,615 |
| 2022 | $6,604 | $553,768 | $250,223 | $303,545 |
| 2021 | $6,494 | $542,910 | $245,316 | $297,594 |
| 2020 | $6,432 | $537,344 | $242,801 | $294,543 |
| 2019 | $6,253 | $526,808 | $238,040 | $288,768 |
| 2018 | $6,145 | $516,479 | $233,373 | $283,106 |
| 2017 | $6,034 | $506,352 | $228,797 | $277,555 |
| 2016 | $5,890 | $496,424 | $224,311 | $272,113 |
| 2015 | $5,722 | $488,968 | $220,942 | $268,026 |
| 2014 | $5,553 | $479,390 | $216,614 | $262,776 |
Source: Public Records
Map
Nearby Homes
- 1414 W Central Ave Unit 81
- 1414 W Central Ave Unit 10
- 1414 W Central Ave Unit 19
- 1381 Harbor Lake Ave Unit 32
- 751 Village Lake
- 1362 Fern Lake Ave Unit 113
- 2210 Lake View Dr Unit 139
- 675 Wood Lake Dr Unit 186
- 736 Knoll Lake Dr Unit 266
- 655 Wood Lake Dr Unit 190
- 2251 Lake Glen Dr
- 2201 Lake View Dr
- 900 De Jur St
- 2121 Lake Side Dr Unit 158
- 2261 Lake Crest Ln Unit 83
- 1011 Delay St
- 521 Forest Lake Dr Unit 64
- 1020 Joyce Dr
- 1163 Delay St
- 304 S Colfax St
- 1514 Allyson Ct
- 1511 Alexander Ct
- 1518 Allyson Ct
- 1509 Allyson Ct
- 1507 Alexander Ct
- 1515 Alexander Ct
- 1513 Allyson Ct
- 1522 Allyson Ct
- 1517 Allyson Ct
- 1519 Alexander Ct
- 1526 Allyson Ct
- 1508 Alexander Ct
- 1521 Allyson Ct
- 1523 Alexander Ct
- 1512 Alexander Ct
- 1516 Alexander Ct
- 1530 Allyson Ct
- 1525 Allyson Ct
- 1520 Alexander Ct
- 1527 Alexander Ct
Your Personal Tour Guide
Ask me questions while you tour the home.