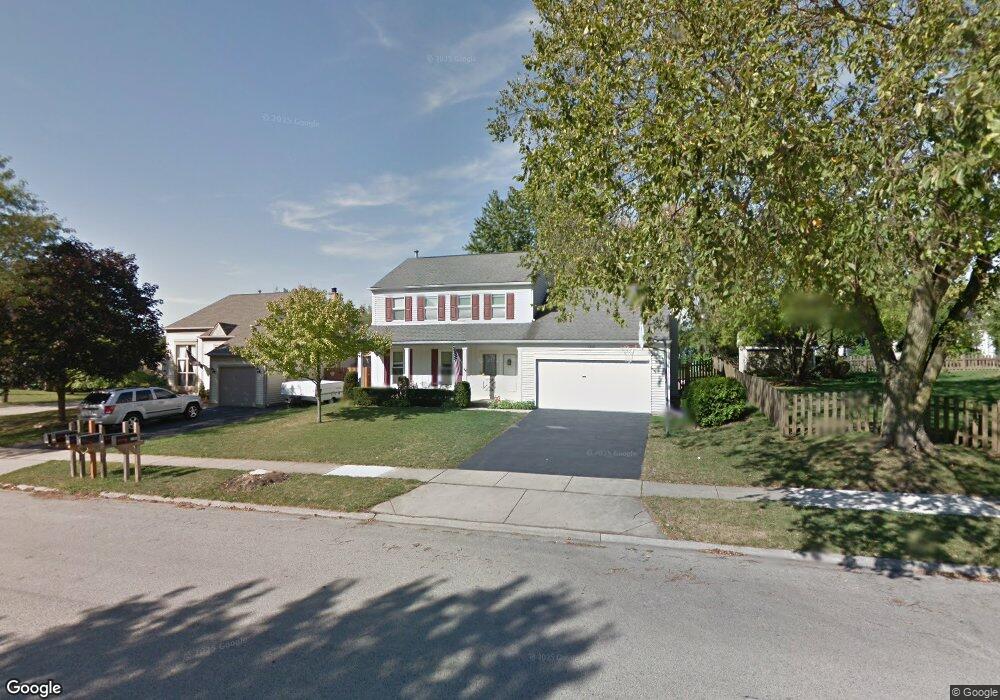
1510 Charles Ave Algonquin, IL 60102
Estimated Value: $360,000 - $375,000
3
Beds
3
Baths
2,000
Sq Ft
$183/Sq Ft
Est. Value
About This Home
This home is located at 1510 Charles Ave, Algonquin, IL 60102 and is currently estimated at $366,850, approximately $183 per square foot. 1510 Charles Ave is a home located in Kane County with nearby schools including Algonquin Lakes Elementary School, Algonquin Middle School, and Dundee-Crown High School.
Ownership History
Date
Name
Owned For
Owner Type
Purchase Details
Closed on
May 12, 2011
Sold by
Mcbride Christopher T and Mc Bride Cheryl R
Bought by
Konishi Allen D and Lauer Konishi Katherine A
Current Estimated Value
Home Financials for this Owner
Home Financials are based on the most recent Mortgage that was taken out on this home.
Original Mortgage
$166,000
Interest Rate
3.97%
Mortgage Type
VA
Purchase Details
Closed on
Oct 27, 2003
Sold by
Rotert Stephen J
Bought by
Mcbride Christopher T and Mcbride Cheryl R
Home Financials for this Owner
Home Financials are based on the most recent Mortgage that was taken out on this home.
Original Mortgage
$216,125
Interest Rate
6.1%
Mortgage Type
Purchase Money Mortgage
Purchase Details
Closed on
Feb 23, 1999
Sold by
Rotert Stephen J
Bought by
Rotert Stephen J and Stephen J Rotert Living Trust
Create a Home Valuation Report for This Property
The Home Valuation Report is an in-depth analysis detailing your home's value as well as a comparison with similar homes in the area
Purchase History
We collect this data history from publicly available records. To have your information removed, we recommend requesting removal directly through your county’s website.
| Date | Buyer | Sale Price | Title Company |
|---|---|---|---|
| Konishi Allen D | $166,000 | Fidelity | |
| Mcbride Christopher T | $227,500 | -- | |
| Rotert Stephen J | -- | First American Title Ins Co |
Source: Public Records
Mortgage History
We collect this data history from publicly available records. To have your information removed, we recommend requesting removal directly through your county’s website.
| Date | Status | Borrower | Loan Amount |
|---|---|---|---|
| Previous Owner | Konishi Allen D | $166,000 | |
| Previous Owner | Mcbride Christopher T | $216,125 |
Source: Public Records
Tax History
| Year | Tax Paid | Tax Assessment Tax Assessment Total Assessment is a certain percentage of the fair market value that is determined by local assessors to be the total taxable value of land and additions on the property. | Land | Improvement |
|---|---|---|---|---|
| 2024 | $7,390 | $102,024 | $24,968 | $77,056 |
| 2023 | $7,051 | $91,797 | $22,465 | $69,332 |
| 2022 | $7,154 | $88,799 | $22,465 | $66,334 |
| 2021 | $6,936 | $83,843 | $21,211 | $62,632 |
| 2020 | $6,804 | $81,958 | $20,734 | $61,224 |
| 2019 | $6,586 | $77,803 | $19,683 | $58,120 |
| 2018 | $6,370 | $72,911 | $19,293 | $53,618 |
| 2017 | $6,157 | $68,205 | $18,048 | $50,157 |
| 2016 | $6,057 | $63,683 | $17,971 | $45,712 |
| 2015 | -- | $59,673 | $16,839 | $42,834 |
| 2014 | -- | $49,530 | $16,374 | $33,156 |
| 2013 | -- | $51,046 | $16,875 | $34,171 |
Source: Public Records
Map
Nearby Homes
- 1705 Charles Ave
- 510 Golden Valley Ln
- 1045 Helen Dr
- lot 25 Wabican Trail
- 26 Washtenaw St
- 0 Natoma Trail
- 410 Mahogany Dr
- 18N988 Angelina Place
- 814 Scott St
- 1961 Cobblestone Dr Unit 481
- 1418 Winaki Trail
- Lot 4 b Ryan Pkwy
- 1770 E Algonquin Rd
- 1117 Silverstone Dr Unit 1109
- 2150 E Algonquin Rd
- 1613 Silverstone Dr Unit 1613
- 1915 Ozark Pkwy
- 2203 Flagstone Ln Unit 122
- 2103 Glacier Ct Unit 31
- 1782 Cumberland Pkwy
- 1520 Charles Ave
- 1025 Louis Ave
- 1015 Louis Ave
- 1510 Teri Ln
- 1005 Louis Ave
- 1520 Teri Ln
- 1505 Meghan Ave
- 1525 Charles Ave
- 1515 Charles Ave
- 1535 Charles Ave
- 1600 Charles Ave Unit 4
- 1515 Meghan Ave
- 1505 Charles Ave
- 1530 Teri Ln
- 1020 Louis Ave
- 1525 Meghan Ave
- 1010 Louis Ave
- 1605 Charles Ave
- 1610 Charles Ave
- 1000 Louis Ave
Your Personal Tour Guide
Ask me questions while you tour the home.