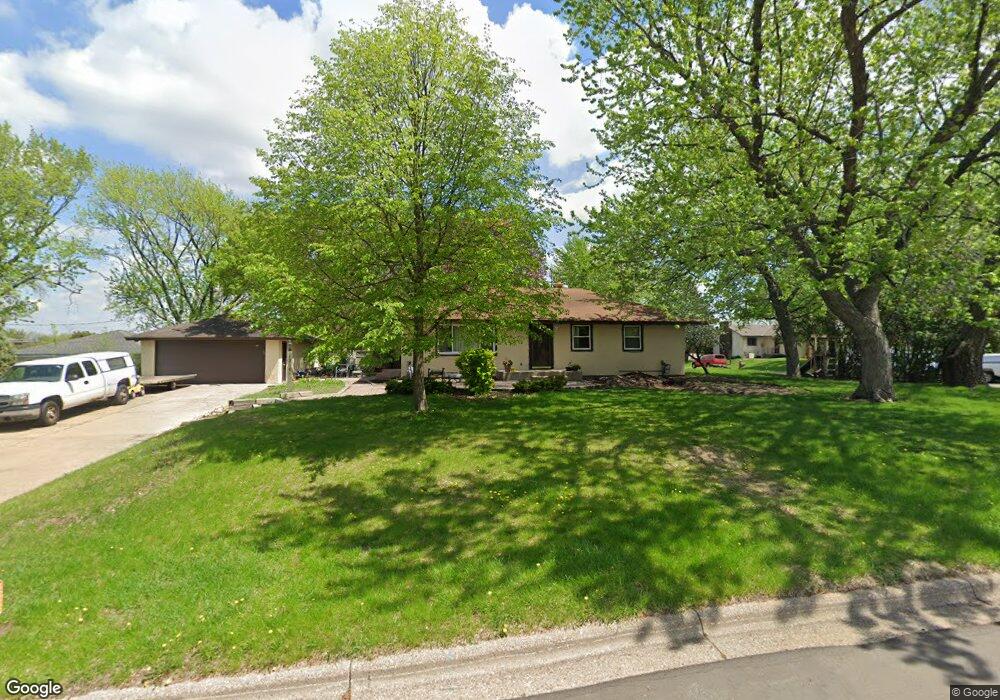
1510 Christensen Ave Saint Paul, MN 55118
Estimated Value: $325,707 - $367,000
4
Beds
1
Bath
1,144
Sq Ft
$302/Sq Ft
Est. Value
About This Home
This home is located at 1510 Christensen Ave, Saint Paul, MN 55118 and is currently estimated at $345,427, approximately $301 per square foot. 1510 Christensen Ave is a home located in Dakota County with nearby schools including Garlough Environmental Magnet, Heritage E-STEM Magnet School, and Two Rivers High School.
Ownership History
Date
Name
Owned For
Owner Type
Purchase Details
Closed on
Oct 11, 2019
Sold by
Mcgie Joseph Roy
Bought by
Clausen Nicole Marie and Mcgie Nicole Marie
Current Estimated Value
Home Financials for this Owner
Home Financials are based on the most recent Mortgage that was taken out on this home.
Original Mortgage
$240,500
Outstanding Balance
$206,870
Interest Rate
2.65%
Mortgage Type
New Conventional
Estimated Equity
$138,557
Purchase Details
Closed on
Oct 10, 2018
Sold by
Coates David L and Coates Sandra L
Bought by
Mcgie Nicole
Home Financials for this Owner
Home Financials are based on the most recent Mortgage that was taken out on this home.
Original Mortgage
$237,500
Interest Rate
4.6%
Mortgage Type
New Conventional
Purchase Details
Closed on
Aug 20, 1997
Sold by
Martin Charles E and Martin Constance Marion
Bought by
Coates David L and Coates Sandra L
Create a Home Valuation Report for This Property
The Home Valuation Report is an in-depth analysis detailing your home's value as well as a comparison with similar homes in the area
Home Values in the Area
Average Home Value in this Area
Purchase History
| Date | Buyer | Sale Price | Title Company |
|---|---|---|---|
| Clausen Nicole Marie | -- | None Available | |
| Mcgie Nicole | $250,000 | On Site Title | |
| Mcgie Nicole | $250,000 | On Site Title | |
| Coates David L | $50,000 | -- |
Source: Public Records
Mortgage History
| Date | Status | Borrower | Loan Amount |
|---|---|---|---|
| Open | Clausen Nicole Marie | $240,500 | |
| Closed | Mcgie Nicole | $237,500 |
Source: Public Records
Tax History Compared to Growth
Tax History
| Year | Tax Paid | Tax Assessment Tax Assessment Total Assessment is a certain percentage of the fair market value that is determined by local assessors to be the total taxable value of land and additions on the property. | Land | Improvement |
|---|---|---|---|---|
| 2024 | $3,506 | $278,800 | $77,100 | $201,700 |
| 2023 | $3,506 | $291,800 | $81,600 | $210,200 |
| 2022 | $3,252 | $267,600 | $81,300 | $186,300 |
| 2021 | $3,198 | $252,600 | $91,600 | $161,000 |
| 2020 | $3,144 | $246,800 | $87,300 | $159,500 |
| 2019 | $2,824 | $236,100 | $83,100 | $153,000 |
| 2018 | $2,686 | $211,300 | $77,700 | $133,600 |
| 2017 | $2,637 | $209,800 | $74,000 | $135,800 |
| 2016 | $2,481 | $198,900 | $67,300 | $131,600 |
| 2015 | $2,469 | $169,205 | $59,119 | $110,086 |
| 2014 | -- | $162,969 | $54,442 | $108,527 |
| 2013 | -- | $152,818 | $49,650 | $103,168 |
Source: Public Records
Map
Nearby Homes
- 362 Trenton Ln
- 366 Trenton Ln
- 1518 Traverse Ln
- 364 Trenton Ln
- 360 Trenton Ln
- 1541 Traverse Ln
- 358 Trenton Ln
- 1522 Traverse Ln
- 1520 Traverse Ln
- 1537 Traverse Ln
- 1526 Traverse Ln
- 1523 Traverse Ln
- 1524 Traverse Ln
- Capri Plan at Thompson Square East
- Barcelona Plan at Thompson Square East
- Athens Plan at Thompson Square East
- Athens II Plan at Thompson Square East
- Bayfield Plan at Thompson Square East
- Hayward Plan at Thompson Square East
- 1531 Traverse Ln
- 419 Schletty Ln
- 1500 Christensen Ave
- 1500 1500 Christensen Ave
- 1507 Christensen Ave
- 1524 Christensen Ave
- 425 Schletty Ln
- 1521 Christensen Ave
- 1525 Waterloo Ave
- 391 Schletty Ln
- 410 Thompson Ave E
- 1532 Christensen Ave
- 416 Thompson Ave E
- 430 Thompson Ave E
- 1529 Christensen Ave
- 394 Thompson Ave E
- 1533 Waterloo Ave
- 385 Schletty Ln
- 1538 Christensen Ave
- 386 Schletty Ln
- 386 Thompson Ave E