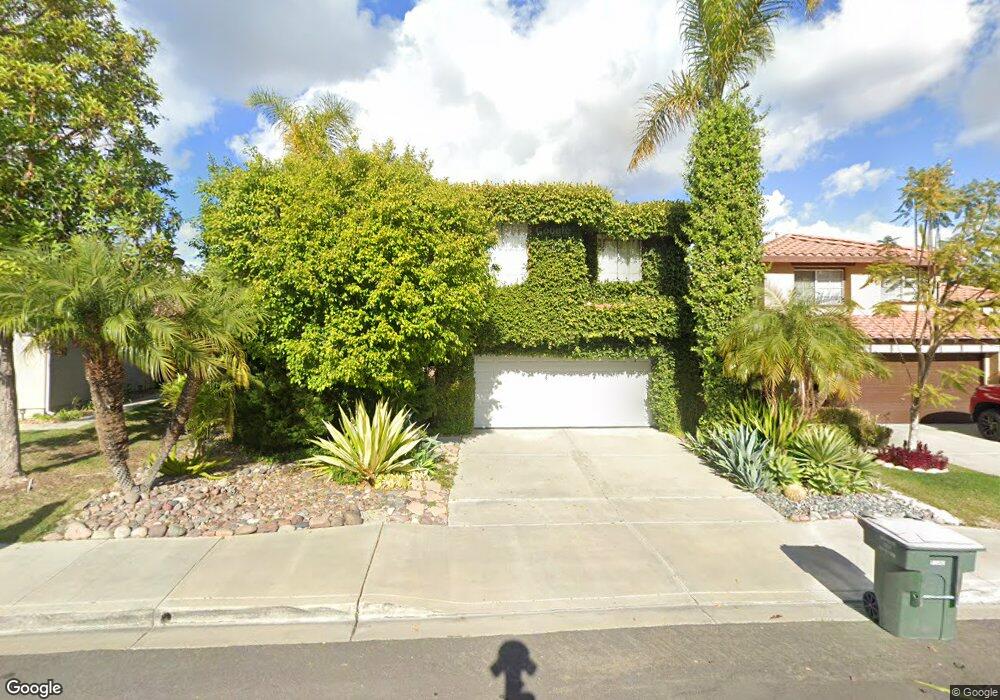
1510 Shoreacres Dr Unit 12 Chula Vista, CA 91915
Eastlake NeighborhoodEstimated Value: $835,000 - $929,000
4
Beds
3
Baths
1,743
Sq Ft
$518/Sq Ft
Est. Value
About This Home
This home is located at 1510 Shoreacres Dr Unit 12, Chula Vista, CA 91915 and is currently estimated at $902,339, approximately $517 per square foot. 1510 Shoreacres Dr Unit 12 is a home located in San Diego County with nearby schools including Olympic View Elementary School, Eastlake Middle School, and Eastlake High School.
Ownership History
Date
Name
Owned For
Owner Type
Purchase Details
Closed on
Mar 18, 2024
Sold by
Marmolejo Jesus G
Bought by
Marm0lej0 Andres
Current Estimated Value
Purchase Details
Closed on
Apr 13, 2007
Sold by
Marmolejo Jesus G and Marmolejo Andres
Bought by
Marmolejo Andres and Marmolejo Jesus G
Home Financials for this Owner
Home Financials are based on the most recent Mortgage that was taken out on this home.
Original Mortgage
$488,000
Interest Rate
6.25%
Mortgage Type
Stand Alone Refi Refinance Of Original Loan
Purchase Details
Closed on
Nov 5, 2002
Sold by
Kilby Christopher W and Kilby Katherine M
Bought by
Marmolejo Jesus G and Marmolejo Andres
Home Financials for this Owner
Home Financials are based on the most recent Mortgage that was taken out on this home.
Original Mortgage
$308,000
Interest Rate
6.06%
Mortgage Type
Stand Alone First
Purchase Details
Closed on
Sep 16, 1996
Sold by
Kaufman & Broad Of San Diego Inc
Bought by
Kilby Christopher W and Kilby Katherine M
Home Financials for this Owner
Home Financials are based on the most recent Mortgage that was taken out on this home.
Original Mortgage
$166,450
Interest Rate
8.11%
Create a Home Valuation Report for This Property
The Home Valuation Report is an in-depth analysis detailing your home's value as well as a comparison with similar homes in the area
Home Values in the Area
Average Home Value in this Area
Purchase History
| Date | Buyer | Sale Price | Title Company |
|---|---|---|---|
| Marm0lej0 Andres | -- | None Listed On Document | |
| Marmolejo Andres | -- | Southland Title Company | |
| Marmolejo Jesus G | $385,000 | Commerce Title Company | |
| Kilby Christopher W | $185,000 | First American Title |
Source: Public Records
Mortgage History
| Date | Status | Borrower | Loan Amount |
|---|---|---|---|
| Previous Owner | Marmolejo Andres | $488,000 | |
| Previous Owner | Marmolejo Jesus G | $308,000 | |
| Previous Owner | Kilby Christopher W | $166,450 |
Source: Public Records
Tax History Compared to Growth
Tax History
| Year | Tax Paid | Tax Assessment Tax Assessment Total Assessment is a certain percentage of the fair market value that is determined by local assessors to be the total taxable value of land and additions on the property. | Land | Improvement |
|---|---|---|---|---|
| 2025 | $6,292 | $737,793 | $356,378 | $381,415 |
| 2024 | $6,292 | $546,658 | $198,783 | $347,875 |
| 2023 | $6,187 | $535,940 | $194,886 | $341,054 |
| 2022 | $6,013 | $525,432 | $191,065 | $334,367 |
| 2021 | $7,034 | $515,130 | $187,319 | $327,811 |
| 2020 | $6,861 | $509,849 | $185,399 | $324,450 |
| 2019 | $6,681 | $499,853 | $181,764 | $318,089 |
| 2018 | $6,562 | $490,052 | $178,200 | $311,852 |
| 2017 | $12 | $480,444 | $174,706 | $305,738 |
| 2016 | $6,388 | $471,025 | $171,281 | $299,744 |
| 2015 | $6,301 | $463,951 | $168,709 | $295,242 |
| 2014 | $6,162 | $400,000 | $144,000 | $256,000 |
Source: Public Records
Map
Nearby Homes
- 1452 S Creekside Dr
- 1603 Quiet Trail Dr
- 2408 Green River Dr
- 1572 Hackberry Place
- 1277 Granite Springs Dr
- 1569 Hackberry Place
- 2710 Apricot Ct
- 2721 Castlehill Rd Unit 1
- 1220 Silverado Dr
- 1215 Pinehurst Rd
- 1427 Marble Canyon Way
- 2745 White Pine Ct
- 1505 Laurel Grove Dr Unit 3
- 1648 Sweet Gum Place
- 2744 Rambling Vista Rd
- 2235 Old Barn Ln
- 2754 Silver Medal Rd Unit 1
- 2770 Sparta Rd Unit 14
- 2770 Sparta Rd Unit 16
- 2816 Weeping Willow Rd
- 1514 Shoreacres Dr
- 1518 Shoreacres Dr
- 2486 Myrtle Beach Way
- 2482 Myrtle Beach Way
- 2490 Myrtle Beach Way Unit 12
- 2478 Myrtle Beach Way
- 1522 Shoreacres Dr
- 2474 Myrtle Beach Way
- 1515 Shoreacres Dr
- 1509 Shoreacres Dr
- 2470 Myrtle Beach Way
- 1526 Shoreacres Dr
- 1487 Shoreacres Dr
- 1505 Shoreacres Dr
- 1519 Shoreacres Dr Unit 12
- 1483 Shoreacres Dr
- 1491 Shoreacres Dr
- 1479 Shoreacres Dr
- 2466 Myrtle Beach Way
- 1501 Shoreacres Dr