R
Seller's Agent in 2026
REGGIE SHAREEF
Kumbaya International Realty Group, LLC.
(678) 852-5256
1 in this area
1 Total Sale
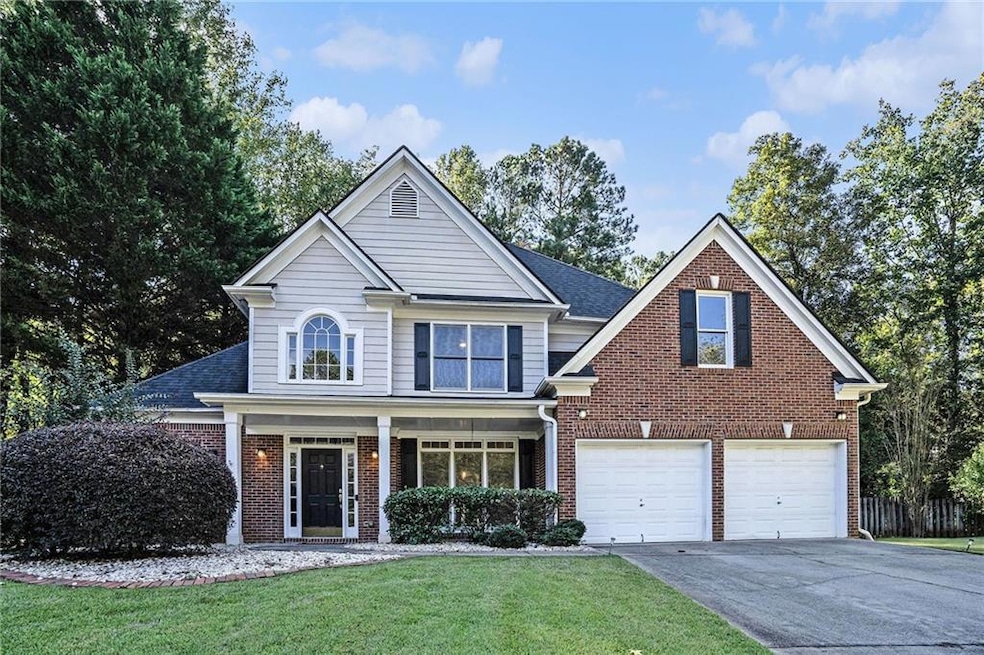
Welcome to 1511 Emerald Glen Drive, a beautifully updated 5-bedroom, 3-bath home tucked away in a quiet cul-de-sac in the heart of Marietta, Georgia. This stunning property features an inviting brick and siding exterior, fresh landscaping, and a welcoming front porch. Inside, you’ll love the open-concept layout with soaring ceilings, abundant natural light, new flooring, and a cozy fireplace that anchors the spacious living room. The modern kitchen boasts white cabinetry, quartz countertops, beautiful backsplash, sleek black hardware, stainless steel/black appliances, and a sunlit breakfast nook overlooking the private, fenced backyard. The serene master on the main primary suite offers a spa-like bathroom with double vanities, a walk-in shower with walkout door to the back patio, while additional bedrooms like the secondary bedroom or office on the main and 3 bedrooms upstairs provide versatility for guests, work, or play. Outside, a charming stone walkway and lush yard create the perfect setting for entertaining or relaxing. Ideally located just minutes from The Avenues of West Cobb, Kennesaw Mountain National Battlefield Park, Marietta Square, top-rated Cobb County schools, and convenient access to I-75, this move-in ready home blends modern comfort with unbeatable location and lifestyle.
Last Agent to Sell the Property
Kumbaya International Realty Group, LLC. Brokerage Phone: 678-852-5256 License #275303 Listed on: 10/20/2025
| Date | Type | Sale Price | Title Company |
|---|---|---|---|
| Special Warranty Deed | $560,000 | None Listed On Document | |
| Warranty Deed | -- | -- | |
| Warranty Deed | $275,000 | -- | |
| Deed | $270,000 | -- | |
| Deed | $211,800 | -- |
| Date | Status | Loan Amount | Loan Type |
|---|---|---|---|
| Open | $448,000 | New Conventional | |
| Previous Owner | $265,375 | FHA | |
| Previous Owner | $216,000 | New Conventional | |
| Previous Owner | $201,150 | New Conventional |
| Date | Event | Price | List to Sale | Price per Sq Ft |
|---|---|---|---|---|
| 02/05/2026 02/05/26 | Sold | $560,000 | -2.6% | $201 / Sq Ft |
| 12/30/2025 12/30/25 | Price Changed | $574,900 | -4.1% | $206 / Sq Ft |
| 12/05/2025 12/05/25 | Price Changed | $599,300 | -0.9% | $215 / Sq Ft |
| 11/15/2025 11/15/25 | Price Changed | $604,500 | -0.8% | $217 / Sq Ft |
| 10/20/2025 10/20/25 | For Sale | $609,500 | +2.6% | $219 / Sq Ft |
| 01/01/1970 01/01/70 | Price Changed | $594,300 | -- | $213 / Sq Ft |
| Year | Tax Paid | Tax Assessment Tax Assessment Total Assessment is a certain percentage of the fair market value that is determined by local assessors to be the total taxable value of land and additions on the property. | Land | Improvement |
|---|---|---|---|---|
| 2025 | $783 | $198,480 | $48,000 | $150,480 |
| 2024 | $783 | $198,480 | $48,000 | $150,480 |
| 2023 | $631 | $198,480 | $48,000 | $150,480 |
| 2022 | $783 | $145,128 | $38,000 | $107,128 |
| 2021 | $802 | $145,128 | $38,000 | $107,128 |
| 2020 | $802 | $145,128 | $38,000 | $107,128 |
| 2019 | $800 | $130,752 | $36,000 | $94,752 |
| 2018 | $800 | $130,752 | $36,000 | $94,752 |
| 2017 | $641 | $119,952 | $36,000 | $83,952 |
| 2016 | $642 | $110,332 | $36,000 | $74,332 |
| 2015 | $698 | $102,588 | $36,000 | $66,588 |
| 2014 | $722 | $102,588 | $0 | $0 |
R
Seller's Agent in 2026
REGGIE SHAREEF
Kumbaya International Realty Group, LLC.
(678) 852-5256
1 in this area
1 Total Sale
K
Buyer's Agent in 2026
Kalim Kalla
ARB Realty, LLC.
(404) 775-2939
1 in this area
8 Total Sales
Source: First Multiple Listing Service (FMLS)
MLS Number: 7665917
APN: 16-0881-0-059-0
![]() Listings identified with the FMLS IDX logo come from FMLS and are held by brokerage firms other than the owner of this website. The listing brokerage is identified in any listing details. Information is deemed reliable but is not guaranteed. If you believe any FMLS listing contains material that infringes your copyrighted work please visit www.fmls.com/dmca to review our DMCA policy and learn how to submit a takedown request. © 2026 First Multiple Listing Service, Inc.
Listings identified with the FMLS IDX logo come from FMLS and are held by brokerage firms other than the owner of this website. The listing brokerage is identified in any listing details. Information is deemed reliable but is not guaranteed. If you believe any FMLS listing contains material that infringes your copyrighted work please visit www.fmls.com/dmca to review our DMCA policy and learn how to submit a takedown request. © 2026 First Multiple Listing Service, Inc.
Disclaimer: Certain information contained herein is derived from information provided by parties other than Homes.com. All information provided is deemed reliable, but is not guaranteed to be accurate and should be independently verified.
Ask me questions while you tour the home.
