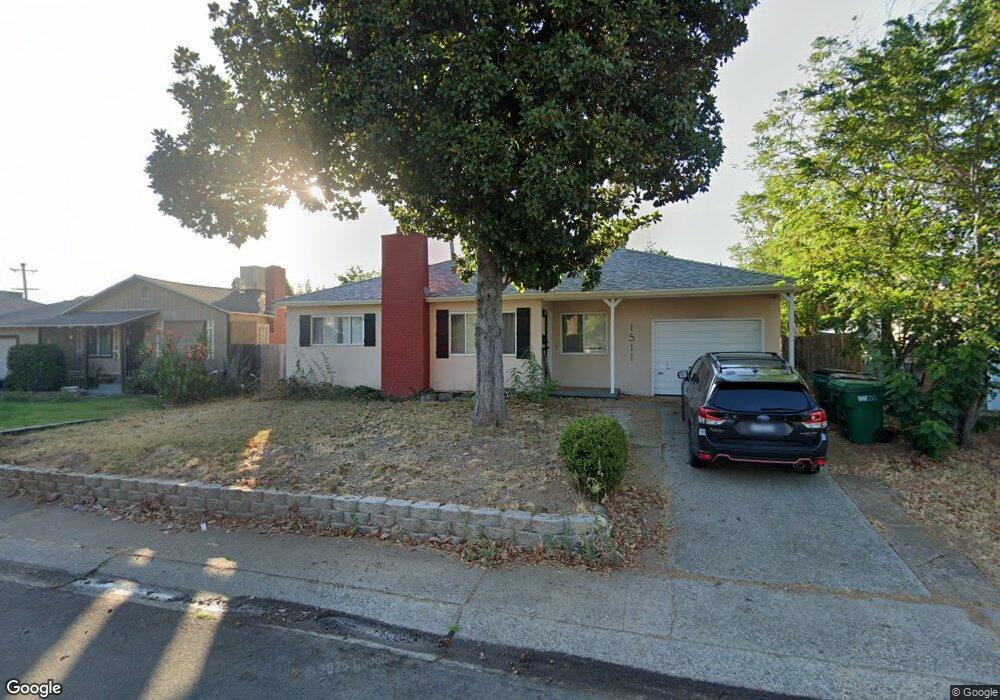
1511 Jeffries St Anderson, CA 96007
Anderson City Center NeighborhoodEstimated Value: $247,000 - $264,000
3
Beds
1
Bath
993
Sq Ft
$257/Sq Ft
Est. Value
About This Home
This home is located at 1511 Jeffries St, Anderson, CA 96007 and is currently estimated at $255,347, approximately $257 per square foot. 1511 Jeffries St is a home located in Shasta County with nearby schools including Anderson Heights Elementary School, Meadow Lane Elementary School, and Anderson Middle School.
Ownership History
Date
Name
Owned For
Owner Type
Purchase Details
Closed on
May 11, 2021
Sold by
Pensco Trust Company Custodian
Bought by
Pacific Premier Trust Company Custodian
Current Estimated Value
Purchase Details
Closed on
Jul 15, 2011
Sold by
Citibank N A
Bought by
Pensco Trust Company
Purchase Details
Closed on
Oct 7, 2010
Sold by
Chenard Dan
Bought by
Citibank N A
Purchase Details
Closed on
Sep 7, 2006
Sold by
Ladner Frank D and Ladner Jean R
Bought by
Chenard Dan
Home Financials for this Owner
Home Financials are based on the most recent Mortgage that was taken out on this home.
Original Mortgage
$148,400
Interest Rate
6.56%
Mortgage Type
New Conventional
Purchase Details
Closed on
Sep 5, 2006
Sold by
Chenard Sayoko
Bought by
Chenard Dan
Home Financials for this Owner
Home Financials are based on the most recent Mortgage that was taken out on this home.
Original Mortgage
$148,400
Interest Rate
6.56%
Mortgage Type
New Conventional
Create a Home Valuation Report for This Property
The Home Valuation Report is an in-depth analysis detailing your home's value as well as a comparison with similar homes in the area
Home Values in the Area
Average Home Value in this Area
Purchase History
| Date | Buyer | Sale Price | Title Company |
|---|---|---|---|
| Pacific Premier Trust Company Custodian | $63,000 | None Available | |
| Pensco Trust Company | $63,000 | Fidelity Natl Title Co Of Ca | |
| Citibank N A | $105,000 | Servicelink | |
| Chenard Dan | $185,500 | Placer Title Company | |
| Chenard Dan | -- | Placer Title Company |
Source: Public Records
Mortgage History
| Date | Status | Borrower | Loan Amount |
|---|---|---|---|
| Previous Owner | Chenard Dan | $148,400 |
Source: Public Records
Tax History
| Year | Tax Paid | Tax Assessment Tax Assessment Total Assessment is a certain percentage of the fair market value that is determined by local assessors to be the total taxable value of land and additions on the property. | Land | Improvement |
|---|---|---|---|---|
| 2025 | $3,001 | $244,077 | $42,448 | $201,629 |
| 2024 | $2,956 | $239,292 | $41,616 | $197,676 |
| 2023 | $2,956 | $234,600 | $40,800 | $193,800 |
| 2022 | $2,788 | $230,000 | $40,000 | $190,000 |
| 2021 | $1,149 | $73,095 | $29,005 | $44,090 |
| 2020 | $1,199 | $72,346 | $28,708 | $43,638 |
| 2019 | $1,166 | $70,929 | $28,146 | $42,783 |
| 2018 | $1,179 | $69,540 | $27,595 | $41,945 |
| 2017 | $1,170 | $68,177 | $27,054 | $41,123 |
| 2016 | $1,103 | $66,841 | $26,524 | $40,317 |
| 2015 | $1,083 | $65,838 | $26,126 | $39,712 |
| 2014 | $1,059 | $64,550 | $25,615 | $38,935 |
Source: Public Records
Map
Nearby Homes
- 1381 Jeffries Ave
- 1326 Jeffries Ave
- 2616 W Hillside Dr
- 1971 Spruce Cir
- 1994 Spruce Cir
- 4855 Sierra Ct Unit 21
- 2895 Church St
- 20306 Mulholland Ridge Dr
- 4838 Ridgeline Dr
- 20295 Domaine Place
- 20284 Domaine Place
- 20287 Domaine Place
- 3008 Church St
- 3040 Silver St
- 3065 Silver St
- 20260 Morgan Hill Ct
- 1765 School St
- 1535 Cordova St
- 1481 Diamond St
- 1785 Brigman St
- 1521 Jeffries St
- 1511 Jeffries Ave
- 1501 Jeffries St
- 1501 Jeffries Ave
- 1531 Jeffries St
- 1574 Lodgepole Ave
- 1562 Lodgepole Ave
- 1543 Jeffries Ave
- 1491 Jeffries Ave
- 1586 Lodgepole Ave
- 1558 Lodgepole Ave
- 1543 Jeffries St
- 1508 Jeffries St
- 1508 Jeffries Ave
- 1518 Jeffries St
- 1498 Jeffries St
- 1518 Jeffries Ave Unit 1
- 1481 Jeffries St
- 1481 Jeffries Ave Unit 1
- 1528 Jeffries St