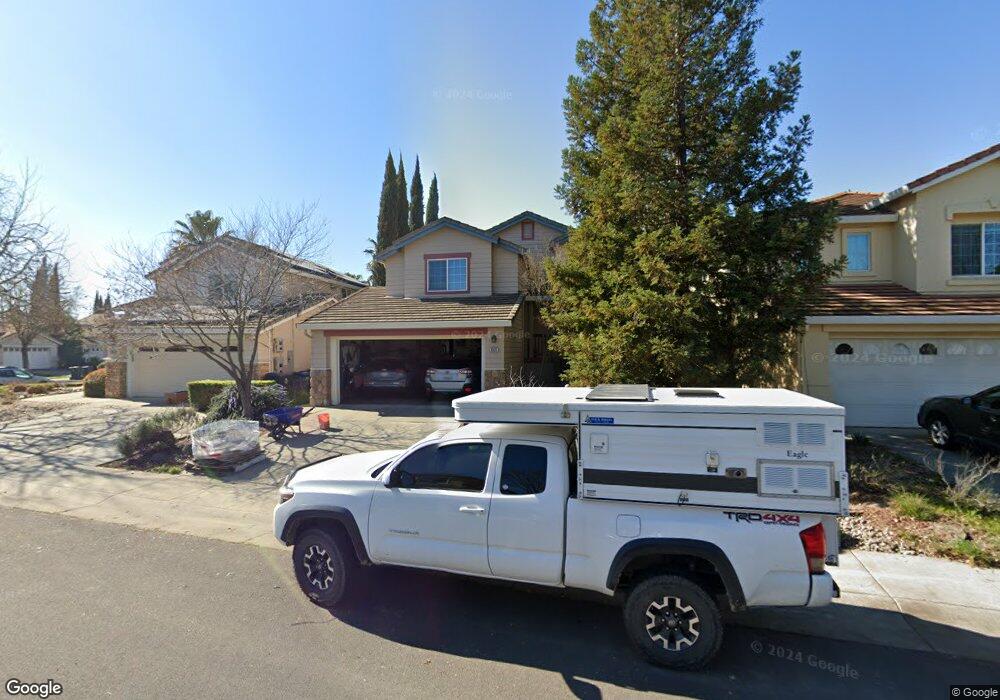
1511 Pastal Way Davis, CA 95618
East Davis NeighborhoodEstimated Value: $611,000 - $847,000
3
Beds
3
Baths
1,595
Sq Ft
$473/Sq Ft
Est. Value
About This Home
This home is located at 1511 Pastal Way, Davis, CA 95618 and is currently estimated at $754,308, approximately $472 per square foot. 1511 Pastal Way is a home located in Yolo County with nearby schools including Fred T. Korematsu Elementary School At Mace Ranch, Frances Ellen Watkins Harper Junior High School, and Davis Senior High School.
Ownership History
Date
Name
Owned For
Owner Type
Purchase Details
Closed on
Jul 10, 2008
Sold by
Drake Mark H
Bought by
Drake Mark H and Mark H Drake 2008 Revocable Tr
Current Estimated Value
Purchase Details
Closed on
Nov 17, 2000
Sold by
Thoreson Bryan P and Thoreson Nita
Bought by
Drake Mark H
Home Financials for this Owner
Home Financials are based on the most recent Mortgage that was taken out on this home.
Original Mortgage
$135,290
Outstanding Balance
$49,781
Interest Rate
7.86%
Estimated Equity
$704,527
Purchase Details
Closed on
Nov 13, 1997
Sold by
Kaufman & Broad Central Valley Inc
Bought by
Thoreson Bryan Paul and Thoreson Nita
Home Financials for this Owner
Home Financials are based on the most recent Mortgage that was taken out on this home.
Original Mortgage
$139,550
Interest Rate
7.23%
Create a Home Valuation Report for This Property
The Home Valuation Report is an in-depth analysis detailing your home's value as well as a comparison with similar homes in the area
Home Values in the Area
Average Home Value in this Area
Purchase History
| Date | Buyer | Sale Price | Title Company |
|---|---|---|---|
| Drake Mark H | -- | None Available | |
| Drake Mark H | $244,500 | Fidelity National Title Co | |
| Thoreson Bryan Paul | $174,500 | First American Title Co |
Source: Public Records
Mortgage History
| Date | Status | Borrower | Loan Amount |
|---|---|---|---|
| Open | Drake Mark H | $135,290 | |
| Previous Owner | Thoreson Bryan Paul | $139,550 |
Source: Public Records
Tax History Compared to Growth
Tax History
| Year | Tax Paid | Tax Assessment Tax Assessment Total Assessment is a certain percentage of the fair market value that is determined by local assessors to be the total taxable value of land and additions on the property. | Land | Improvement |
|---|---|---|---|---|
| 2025 | $6,384 | $369,152 | $90,399 | $278,753 |
| 2023 | $6,384 | $354,820 | $86,890 | $267,930 |
| 2022 | $6,201 | $347,864 | $85,187 | $262,677 |
| 2021 | $6,089 | $341,044 | $83,517 | $257,527 |
| 2020 | $6,002 | $337,548 | $82,661 | $254,887 |
| 2019 | $5,732 | $330,931 | $81,041 | $249,890 |
| 2018 | $5,426 | $324,443 | $79,452 | $244,991 |
| 2017 | $5,338 | $318,083 | $77,895 | $240,188 |
| 2016 | $5,224 | $311,847 | $76,368 | $235,479 |
| 2015 | $5,060 | $307,163 | $75,221 | $231,942 |
| 2014 | $5,060 | $301,147 | $73,748 | $227,399 |
Source: Public Records
Map
Nearby Homes
- 1540 Pastal Way
- 1408 Santander Ct
- 3423 Verona Terrace
- 3309 La Playa Dr
- 1008 San Gallo Terrace
- 4138 Cowell Blvd
- 217 La Vida Way
- 4108 Cowell Blvd
- 4403 Vista Way
- 4121 Vista Way
- 4306 Vista Way
- 381 Becerra Way
- 44214 N El Macero Dr
- 5033 El Cemonte Ave
- 5039 El Cemonte Ave
- 26894 Middle Golf Dr
- 2862 Mallorca Ln
- 2805 Prado Ln
- 4606 San Marino Dr
- 2620 Belmont Dr
- 1517 Pastal Way
- 1505 Pastal Way
- 1529 Pastal Way
- 1510 Pastal Way
- 1516 Pastal Way
- 1404 Escolar Ct
- 1522 Pastal Way
- 1535 Pastal Way
- 1436 Pastal Way
- 1442 Pastal Way
- 1448 Pastal Way
- 1528 Pastal Way
- 1430 Pastal Way
- 1410 Escolar Ct
- 1541 Pastal Way
- 1424 Pastal Way
- 1534 Pastal Way
- 1416 Escolar Ct
- 1418 Pastal Way
- 1547 Pastal Way