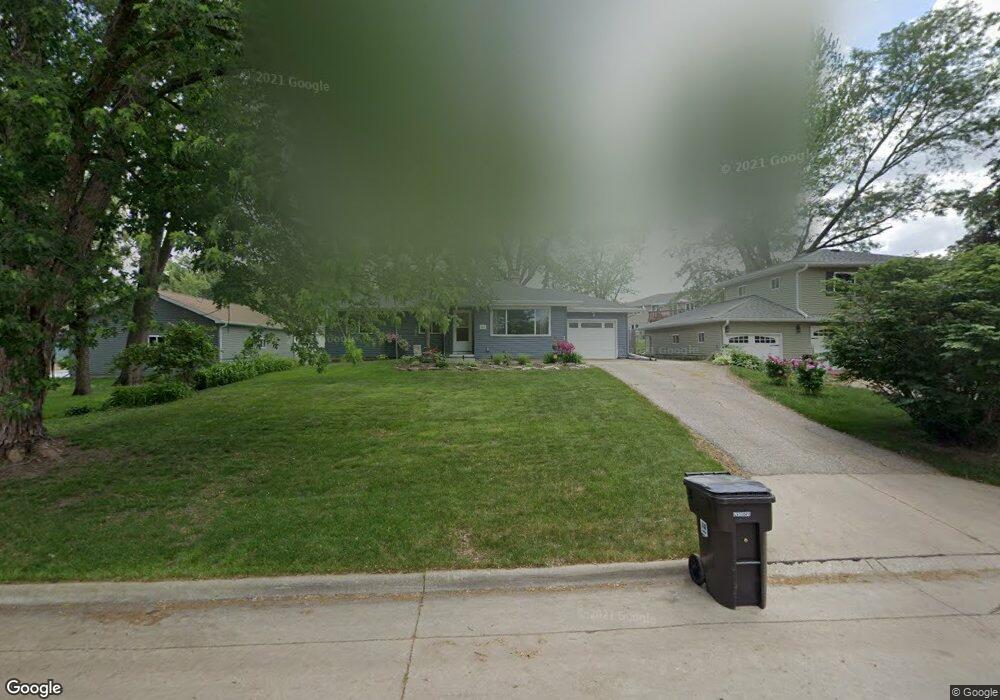
1511 Pin Oak Dr Cedar Falls, IA 50613
Estimated Value: $203,645 - $230,000
3
Beds
2
Baths
1,144
Sq Ft
$188/Sq Ft
Est. Value
About This Home
This home is located at 1511 Pin Oak Dr, Cedar Falls, IA 50613 and is currently estimated at $215,161, approximately $188 per square foot. 1511 Pin Oak Dr is a home located in Black Hawk County with nearby schools including Cedar Heights Elementary School, Peet Junior High School, and Cedar Falls High School.
Ownership History
Date
Name
Owned For
Owner Type
Purchase Details
Closed on
Aug 1, 2016
Sold by
Klad Properties Llc
Bought by
Blanshan Jill R
Current Estimated Value
Purchase Details
Closed on
Oct 28, 2009
Sold by
Christie David A and Christie Lonna K
Bought by
Co Klad Properties Llc
Purchase Details
Closed on
Mar 13, 2009
Sold by
Johnson Joann E and Johnson Paul D
Bought by
Chrstie David A and Chrstie Lonna K
Purchase Details
Closed on
Sep 19, 2008
Sold by
Hill Cindy R
Bought by
Johnson Joann E
Home Financials for this Owner
Home Financials are based on the most recent Mortgage that was taken out on this home.
Original Mortgage
$95,451
Interest Rate
6.52%
Mortgage Type
New Conventional
Create a Home Valuation Report for This Property
The Home Valuation Report is an in-depth analysis detailing your home's value as well as a comparison with similar homes in the area
Home Values in the Area
Average Home Value in this Area
Purchase History
| Date | Buyer | Sale Price | Title Company |
|---|---|---|---|
| Blanshan Jill R | $135,375 | None Available | |
| Co Klad Properties Llc | -- | None Available | |
| Chrstie David A | $122,500 | None Available | |
| Johnson Joann E | $94,000 | None Available |
Source: Public Records
Mortgage History
| Date | Status | Borrower | Loan Amount |
|---|---|---|---|
| Previous Owner | Johnson Joann E | $95,451 |
Source: Public Records
Tax History
| Year | Tax Paid | Tax Assessment Tax Assessment Total Assessment is a certain percentage of the fair market value that is determined by local assessors to be the total taxable value of land and additions on the property. | Land | Improvement |
|---|---|---|---|---|
| 2025 | $2,790 | $202,620 | $24,500 | $178,120 |
| 2024 | $2,790 | $183,570 | $24,500 | $159,070 |
| 2023 | $2,714 | $183,570 | $24,500 | $159,070 |
| 2022 | $2,744 | $155,850 | $24,500 | $131,350 |
| 2021 | $2,434 | $155,850 | $24,500 | $131,350 |
| 2020 | $2,382 | $139,330 | $21,000 | $118,330 |
| 2019 | $2,382 | $139,330 | $21,000 | $118,330 |
| 2018 | $2,414 | $139,330 | $21,000 | $118,330 |
| 2017 | $2,630 | $139,330 | $21,000 | $118,330 |
| 2016 | $2,462 | $139,330 | $21,000 | $118,330 |
| 2015 | $2,462 | $139,330 | $21,000 | $118,330 |
| 2014 | $2,394 | $133,950 | $21,000 | $112,950 |
Source: Public Records
Map
Nearby Homes
- 5634 University Ave
- 2610 Mcclain Dr
- 2109 Victory Dr
- 1421 Madison St
- 1204 Sunnyside Cir
- 3004 Mcclain Dr
- 3120 Homeway Dr
- 1421 Rainbow Dr
- 1233 Rainbow Dr
- 2015 Waterloo Rd
- 1916 Rainbow Dr
- 2519 Valley Park Dr
- 2122 Bicentennial Dr
- 1623 Grand Blvd
- 2021 Grand Blvd
- 2804 Sunny Ln
- 1310 Lilac Ln
- 2203 Grand Blvd
- 2320 Rainbow Dr
- 3228 Rownd St
- 1503 Pin Oak Dr
- 2515 Victory Dr
- 2521 Victory Dr
- 2610 Waterloo Rd
- 2618 Waterloo Rd
- 1410 Pin Oak Dr
- 2509 Victory Dr
- 1418 Pin Oak Dr
- 2601 Victory Dr
- 2613 Victory Dr
- 2607 Victory Dr
- 2619 Victory Dr
- 1516 Pin Oak Dr
- 2512 Victory Dr
- 2428 Russell Dr
- 1603 Pin Oak Dr
- 2704 Acorn Ln
- 2703 Acorn Ln
- 1604 Pin Oak Dr
- 2516 Victory Dr
Your Personal Tour Guide
Ask me questions while you tour the home.