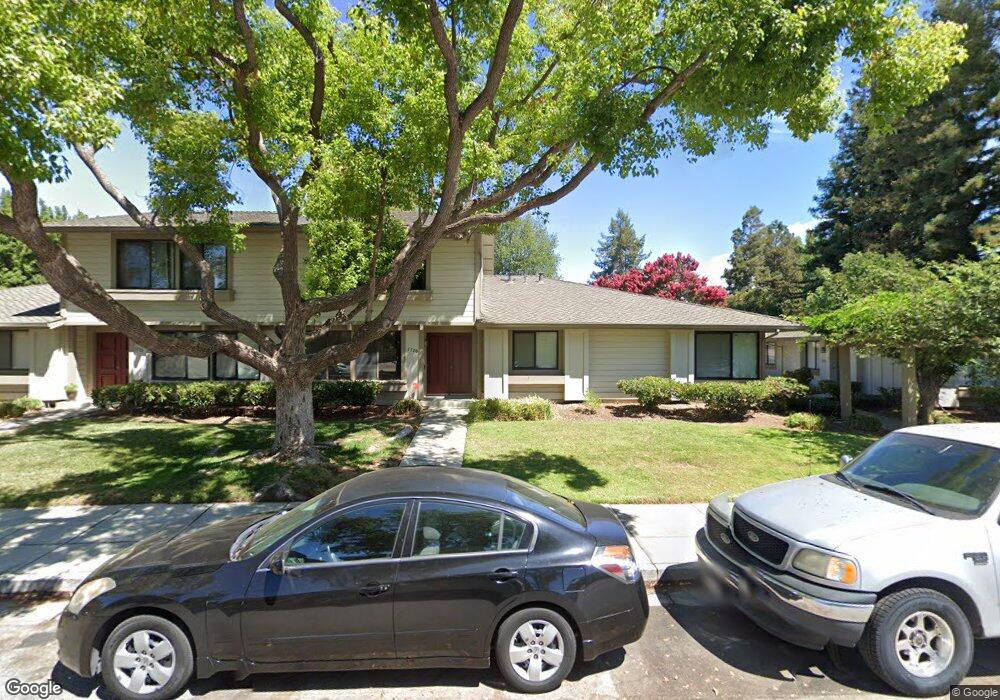
1511 Rhinecliff Way San Jose, CA 95126
Willow Glen NeighborhoodEstimated Value: $867,000 - $1,070,000
3
Beds
2
Baths
1,310
Sq Ft
$738/Sq Ft
Est. Value
About This Home
This home is located at 1511 Rhinecliff Way, San Jose, CA 95126 and is currently estimated at $967,245, approximately $738 per square foot. 1511 Rhinecliff Way is a home located in Santa Clara County with nearby schools including Del Mar High School, Blackford Elementary, and Sherman Oaks Elementary School.
Ownership History
Date
Name
Owned For
Owner Type
Purchase Details
Closed on
Feb 10, 2015
Sold by
Russo Laurentiu
Bought by
San Jose Matrix Llc
Current Estimated Value
Purchase Details
Closed on
Oct 20, 2011
Sold by
California Housing Finance Agency
Bought by
Russo Laurentiu
Purchase Details
Closed on
May 5, 2011
Sold by
Adame Bryan Anthony and Fuentes Monica
Bought by
California Housing Finance Agency
Purchase Details
Closed on
Oct 25, 2004
Sold by
Vonholt Christopher T
Bought by
Adame Bryan Anthony and Fuentes Monica
Home Financials for this Owner
Home Financials are based on the most recent Mortgage that was taken out on this home.
Original Mortgage
$405,000
Interest Rate
5.79%
Mortgage Type
Stand Alone First
Purchase Details
Closed on
Jun 6, 2000
Sold by
Sadler Stephen
Bought by
Vonholt Christopher J
Home Financials for this Owner
Home Financials are based on the most recent Mortgage that was taken out on this home.
Original Mortgage
$280,000
Interest Rate
8.12%
Create a Home Valuation Report for This Property
The Home Valuation Report is an in-depth analysis detailing your home's value as well as a comparison with similar homes in the area
Home Values in the Area
Average Home Value in this Area
Purchase History
| Date | Buyer | Sale Price | Title Company |
|---|---|---|---|
| San Jose Matrix Llc | -- | None Available | |
| Russo Laurentiu | $339,750 | Chicago Title Company | |
| California Housing Finance Agency | $391,956 | Accommodation | |
| Adame Bryan Anthony | $445,000 | North American Title Company | |
| Vonholt Christopher J | $380,000 | First American Title Co |
Source: Public Records
Mortgage History
| Date | Status | Borrower | Loan Amount |
|---|---|---|---|
| Previous Owner | Adame Bryan Anthony | $405,000 | |
| Previous Owner | Vonholt Christopher J | $280,000 |
Source: Public Records
Tax History Compared to Growth
Tax History
| Year | Tax Paid | Tax Assessment Tax Assessment Total Assessment is a certain percentage of the fair market value that is determined by local assessors to be the total taxable value of land and additions on the property. | Land | Improvement |
|---|---|---|---|---|
| 2025 | $6,332 | $427,048 | $213,524 | $213,524 |
| 2024 | $6,332 | $418,676 | $209,338 | $209,338 |
| 2023 | $6,201 | $410,468 | $205,234 | $205,234 |
| 2022 | $6,186 | $402,420 | $201,210 | $201,210 |
| 2021 | $6,045 | $394,530 | $197,265 | $197,265 |
| 2020 | $5,857 | $390,486 | $195,243 | $195,243 |
| 2019 | $5,767 | $382,830 | $191,415 | $191,415 |
| 2018 | $5,608 | $375,324 | $187,662 | $187,662 |
| 2017 | $5,534 | $367,966 | $183,983 | $183,983 |
| 2016 | $5,231 | $360,752 | $180,376 | $180,376 |
| 2015 | $5,156 | $355,334 | $177,667 | $177,667 |
| 2014 | $4,563 | $348,374 | $174,187 | $174,187 |
Source: Public Records
Map
Nearby Homes
- 1515 Rhinecliff Way
- 1182 Leigh Ave
- 1566 Stokes St
- 1230 Leigh Ave
- 1751 Willow St
- 1785 Santa Barbara Dr
- 1990 Southwest Expy
- 1503 Willowhaven Ct
- 1522 Mckinley Ave
- 1874 Huxley Ct
- 1831 Ashmeade Ct
- 960 Lakeshire Ct
- 1932 Huxley Ct
- 1522 Huddersfield Ct
- 1668 Dolores Dr
- 2043 Sonador Commons
- 2067 Sonador Commons
- 1751 Braddock Ct
- 1405 Allegado Alley Unit 86
- 1721 Braddock Ct
- 1513 Rhinecliff Way Unit 92
- 1513 Rhinecliff Way
- 1509 Rhinecliff Way Unit 90
- 1507 Rhinecliff Way
- 1546 Easington Way
- 1548 Easington Way
- 1550 Easington Way Unit 84
- 1552 Easington Way
- 1554 Easington Way Unit 82
- 1506 Rhinecliff Way
- 1508 Rhinecliff Way
- 1510 Rhinecliff Way
- 1512 Rhinecliff Way
- 1220 Francisco Ave
- 1206 Francisco Ave
- 1542 Easington Way Unit 81
- 1544 Easington Way
- 1234 Francisco Ave
- 1192 Francisco Ave
- 1248 Francisco Ave