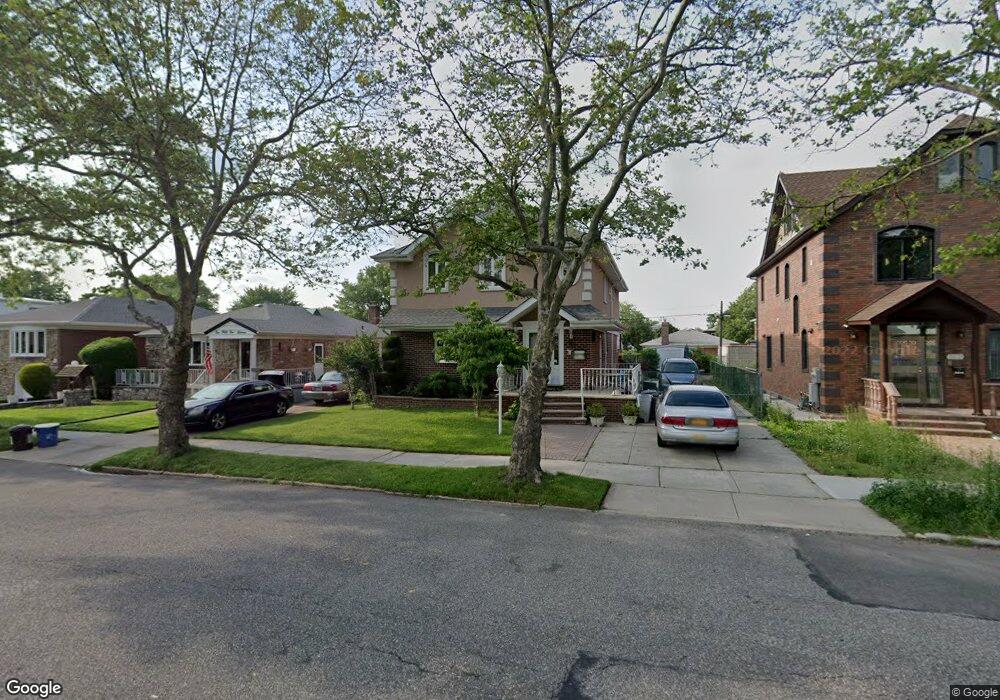
15117 26th Ave Flushing, NY 11354
Murray Hill-Broadway NeighborhoodEstimated Value: $1,416,000 - $1,730,000
Studio
--
Bath
2,288
Sq Ft
$672/Sq Ft
Est. Value
About This Home
This home is located at 15117 26th Ave, Flushing, NY 11354 and is currently estimated at $1,538,259, approximately $672 per square foot. 15117 26th Ave is a home located in Queens County with nearby schools including P.S. 21 Edward Hart, Jhs 185 Edward Bleeker, and Flushing High School.
Ownership History
Date
Name
Owned For
Owner Type
Purchase Details
Closed on
Jan 25, 2010
Sold by
Veneziano Lisa
Bought by
Carrieri-Veneziano Lisa
Current Estimated Value
Home Financials for this Owner
Home Financials are based on the most recent Mortgage that was taken out on this home.
Original Mortgage
$340,862
Outstanding Balance
$225,390
Interest Rate
5.17%
Mortgage Type
Purchase Money Mortgage
Estimated Equity
$1,312,869
Purchase Details
Closed on
Feb 23, 2005
Sold by
Veneziano Lisa and Veneziano Rocco
Bought by
Veneziano Lisa
Purchase Details
Closed on
Sep 19, 1997
Sold by
Marxe Maxwell and Marxe Austin
Bought by
Veneziano Rocco and Veneziano Lisa
Purchase Details
Closed on
Mar 15, 1994
Sold by
Marxe Maxwell and Marxe Austin
Bought by
Marxe Maxwell and Marxe Austin
Create a Home Valuation Report for This Property
The Home Valuation Report is an in-depth analysis detailing your home's value as well as a comparison with similar homes in the area
Home Values in the Area
Average Home Value in this Area
Purchase History
| Date | Buyer | Sale Price | Title Company |
|---|---|---|---|
| Carrieri-Veneziano Lisa | -- | -- | |
| Carrieri-Veneziano Lisa | -- | -- | |
| Veneziano Lisa | -- | -- | |
| Veneziano Lisa | -- | -- | |
| Veneziano Rocco | $250,000 | -- | |
| Veneziano Rocco | $250,000 | -- | |
| Marxe Maxwell | -- | -- | |
| Marxe Maxwell | -- | -- |
Source: Public Records
Mortgage History
| Date | Status | Borrower | Loan Amount |
|---|---|---|---|
| Open | Carrieri-Veneziano Lisa | $340,862 | |
| Closed | Carrieri-Veneziano Lisa | $340,862 | |
| Closed | Veneziano Lisa | $0 |
Source: Public Records
Tax History
| Year | Tax Paid | Tax Assessment Tax Assessment Total Assessment is a certain percentage of the fair market value that is determined by local assessors to be the total taxable value of land and additions on the property. | Land | Improvement |
|---|---|---|---|---|
| 2025 | $14,629 | $73,267 | $22,785 | $50,482 |
| 2024 | $7,314 | $72,835 | $21,278 | $51,557 |
| 2023 | $7,303 | $72,716 | $23,359 | $49,357 |
| 2022 | $6,847 | $88,200 | $29,220 | $58,980 |
| 2021 | $6,810 | $81,960 | $29,220 | $52,740 |
| 2020 | $4,001 | $80,700 | $29,220 | $51,480 |
| 2019 | $10,236 | $88,860 | $29,220 | $59,640 |
| 2018 | $12,353 | $60,597 | $22,239 | $38,358 |
| 2017 | $11,653 | $57,167 | $22,380 | $34,787 |
| 2016 | $10,782 | $57,167 | $22,380 | $34,787 |
| 2015 | $6,893 | $50,880 | $32,460 | $18,420 |
| 2014 | $6,893 | $50,580 | $32,460 | $18,120 |
Source: Public Records
Map
Nearby Homes
- 151-23 26th Ave
- 151-65 26th Ave
- 151-67 27th Ave
- 151-28 24th Rd
- 15016 26th Ave
- 25-47 150th St
- 154-19 26th Ave
- 150-38 24th Ave
- 154-28 27th Ave
- 15428 27th Ave
- 154-07 24th Rd
- 154-43 25th Dr
- 154-24 27th Ave
- 30-27 Murray Ln
- 28-14 157th St
- 157-22 25th Dr
- 153-06 32nd Ave
- 32-15 Murray Ln
- 30-11 149th St
- 15411 Willets Point Blvd
Your Personal Tour Guide
Ask me questions while you tour the home.