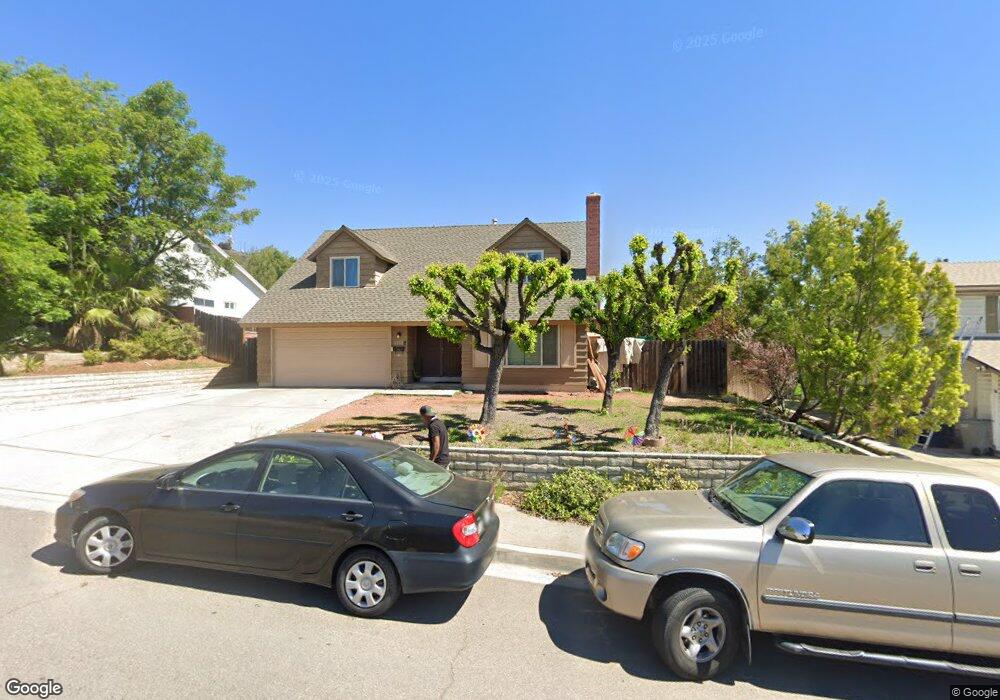
1512 N Ash St Escondido, CA 92027
Midway NeighborhoodEstimated Value: $817,000 - $901,000
4
Beds
3
Baths
2,088
Sq Ft
$416/Sq Ft
Est. Value
About This Home
This home is located at 1512 N Ash St, Escondido, CA 92027 and is currently estimated at $867,608, approximately $415 per square foot. 1512 N Ash St is a home located in San Diego County with nearby schools including Conway Elementary School, Rincon Middle School, and Escondido High School.
Ownership History
Date
Name
Owned For
Owner Type
Purchase Details
Closed on
Aug 28, 2025
Sold by
Charles Owen Gaylor Iii 2024 Trust and Gaylor Charles Owen
Bought by
Charles Owen Gaylor Iii 2024 Trust and Gaylor
Current Estimated Value
Home Financials for this Owner
Home Financials are based on the most recent Mortgage that was taken out on this home.
Original Mortgage
$619,000
Outstanding Balance
$619,000
Interest Rate
6.74%
Mortgage Type
New Conventional
Estimated Equity
$248,608
Purchase Details
Closed on
Mar 18, 2024
Sold by
Gaylor Charles Owen
Bought by
Charles Owen Gaylor Iii 2024 Trust and Gaylor
Purchase Details
Closed on
Feb 12, 2016
Sold by
Whitehouse Patricia A Finneran
Bought by
Gaylor Charles Owen
Purchase Details
Closed on
Oct 6, 2015
Sold by
Finneran Joseph Kieran
Bought by
Whitehouse Patricia A Finneran
Create a Home Valuation Report for This Property
The Home Valuation Report is an in-depth analysis detailing your home's value as well as a comparison with similar homes in the area
Home Values in the Area
Average Home Value in this Area
Purchase History
| Date | Buyer | Sale Price | Title Company |
|---|---|---|---|
| Charles Owen Gaylor Iii 2024 Trust | -- | None Listed On Document | |
| Charles Owen Gaylor Iii 2024 Trust | -- | None Listed On Document | |
| Gaylor Charles Owen | $310,000 | First American Title Ins Co | |
| Whitehouse Patricia A Finneran | -- | None Available |
Source: Public Records
Mortgage History
| Date | Status | Borrower | Loan Amount |
|---|---|---|---|
| Open | Charles Owen Gaylor Iii 2024 Trust | $619,000 |
Source: Public Records
Tax History Compared to Growth
Tax History
| Year | Tax Paid | Tax Assessment Tax Assessment Total Assessment is a certain percentage of the fair market value that is determined by local assessors to be the total taxable value of land and additions on the property. | Land | Improvement |
|---|---|---|---|---|
| 2025 | $5,788 | $515,060 | $307,783 | $207,277 |
| 2024 | $5,788 | $504,962 | $301,749 | $203,213 |
| 2023 | $5,657 | $495,062 | $295,833 | $199,229 |
| 2022 | $5,597 | $485,356 | $290,033 | $195,323 |
| 2021 | $5,507 | $475,841 | $284,347 | $191,494 |
| 2020 | $5,475 | $470,963 | $281,432 | $189,531 |
| 2019 | $5,343 | $461,729 | $275,914 | $185,815 |
| 2018 | $5,195 | $452,676 | $270,504 | $182,172 |
| 2017 | $5,168 | $448,800 | $265,200 | $183,600 |
| 2016 | $990 | $83,877 | $19,687 | $64,190 |
| 2015 | $901 | $82,618 | $19,392 | $63,226 |
| 2014 | $864 | $81,001 | $19,013 | $61,988 |
Source: Public Records
Map
Nearby Homes
- 1228 Sheridan Ave
- 1466 Conway Dr Unit 227-520-65-00
- 0 Hubbard Place Unit PTP2405367
- 1213 Rembrandt Glen
- 1523 Nob Hill Dr
- 159 La Lomita Dr
- 1572 Tibidabo Dr
- 1247 Armstrong Cir
- 1650 N Broadway
- 1234 N Ivy St
- 1907 Centennial Way
- 140 E El Norte Pkwy Unit 44
- 140 E El Norte Pkwy Unit 50
- 1615 Stanley Way
- 2035 Woolem Place
- Cardiff Plan at Capistrano
- Terramar Plan at Capistrano
- Grandview Plan at Capistrano
- 1463 N Broadway Unit E
- 2046 Woolem Place
- 1522 N Ash St
- 1521 Rincon Villa Dr
- 1511 Rincon Villa Dr
- 1531 Rincon Villa Dr
- 1002 Sheridan Ave
- 1532 N Ash St
- 1501 Rincon Villa Dr
- 1511 N Ash St
- 1521 N Ash St
- 1542 N Ash St
- 1541 Rincon Villa Dr
- 1501 N Ash St
- 1531 N Ash St
- 1522 Rincon Villa Dr
- 1512 Rincon Villa Dr
- 1472 N Ash St
- 1030 Rincon Villa Place
- 1461 Rincon Villa Dr
- 920 Jacaranda Place
- 1502 Rincon Villa Dr