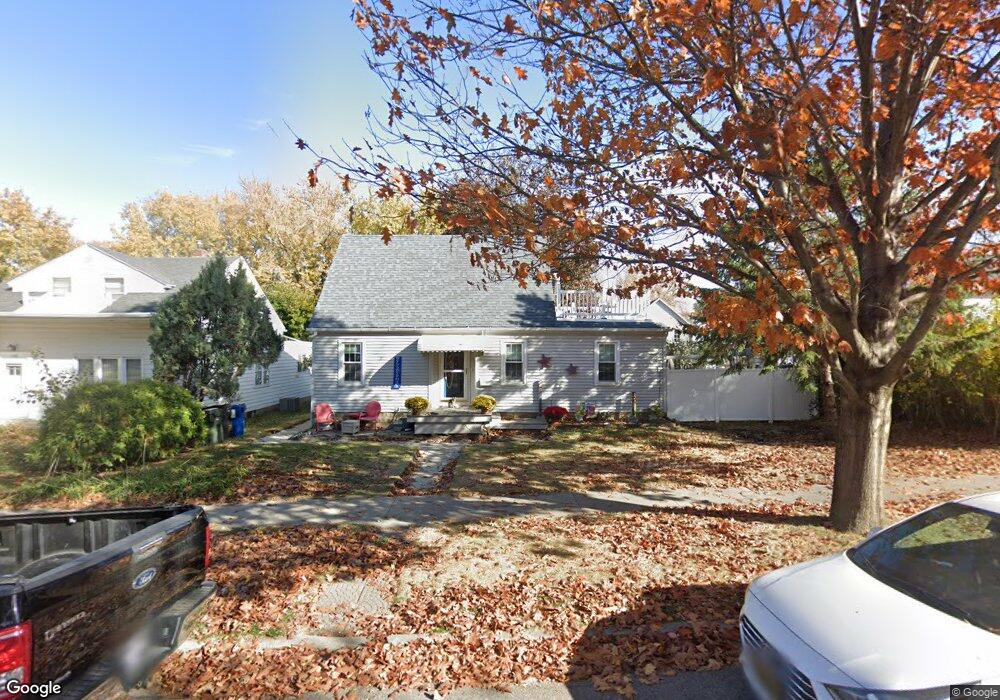
1512 Walnut St Cedar Falls, IA 50613
Estimated Value: $189,000 - $215,000
3
Beds
2
Baths
1,130
Sq Ft
$177/Sq Ft
Est. Value
About This Home
This home is located at 1512 Walnut St, Cedar Falls, IA 50613 and is currently estimated at $200,008, approximately $176 per square foot. 1512 Walnut St is a home located in Black Hawk County with nearby schools including Lincoln Elementary School, Holmes Junior High School, and Cedar Falls High School.
Ownership History
Date
Name
Owned For
Owner Type
Purchase Details
Closed on
Dec 22, 2016
Sold by
Bruess Laura and Walker Laura
Bought by
Bruess Donn and Bruess Laura
Current Estimated Value
Purchase Details
Closed on
May 4, 2011
Sold by
Walker Michael E and Walker Michael Earl
Bought by
Walker Laura Lee and Walker Laura L
Home Financials for this Owner
Home Financials are based on the most recent Mortgage that was taken out on this home.
Original Mortgage
$123,500
Interest Rate
4.86%
Mortgage Type
New Conventional
Create a Home Valuation Report for This Property
The Home Valuation Report is an in-depth analysis detailing your home's value as well as a comparison with similar homes in the area
Home Values in the Area
Average Home Value in this Area
Purchase History
| Date | Buyer | Sale Price | Title Company |
|---|---|---|---|
| Bruess Donn | -- | None Available | |
| Walker Laura Lee | $500 | None Available |
Source: Public Records
Mortgage History
| Date | Status | Borrower | Loan Amount |
|---|---|---|---|
| Closed | Walker Laura Lee | $123,500 |
Source: Public Records
Tax History Compared to Growth
Tax History
| Year | Tax Paid | Tax Assessment Tax Assessment Total Assessment is a certain percentage of the fair market value that is determined by local assessors to be the total taxable value of land and additions on the property. | Land | Improvement |
|---|---|---|---|---|
| 2025 | $2,520 | $198,350 | $45,280 | $153,070 |
| 2024 | $2,520 | $175,320 | $29,110 | $146,210 |
| 2023 | $2,508 | $175,320 | $29,110 | $146,210 |
| 2022 | $2,536 | $148,130 | $29,110 | $119,020 |
| 2021 | $2,386 | $148,130 | $29,110 | $119,020 |
| 2020 | $2,334 | $140,040 | $21,020 | $119,020 |
| 2019 | $2,334 | $140,040 | $21,020 | $119,020 |
| 2018 | $2,310 | $137,010 | $21,020 | $115,990 |
| 2017 | $2,459 | $137,010 | $21,020 | $115,990 |
| 2016 | $2,268 | $137,010 | $21,020 | $115,990 |
| 2015 | $2,268 | $137,010 | $21,020 | $115,990 |
| 2014 | $1,930 | $116,710 | $21,020 | $95,690 |
Source: Public Records
Map
Nearby Homes