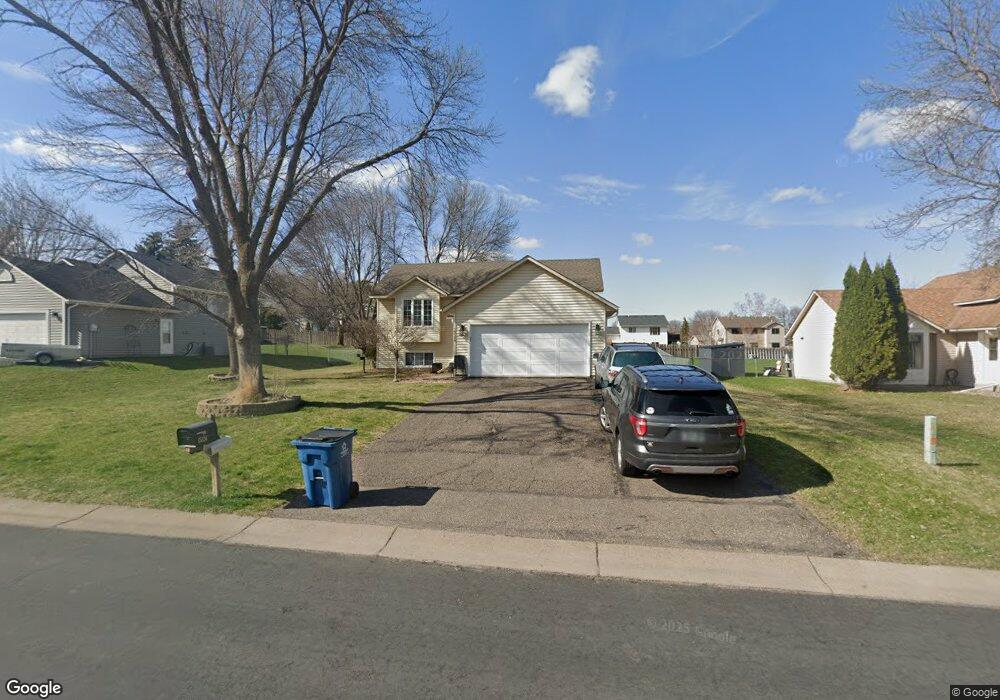
15124 92nd Place N Maple Grove, MN 55369
Estimated Value: $381,000 - $407,000
4
Beds
2
Baths
997
Sq Ft
$397/Sq Ft
Est. Value
About This Home
This home is located at 15124 92nd Place N, Maple Grove, MN 55369 and is currently estimated at $395,963, approximately $397 per square foot. 15124 92nd Place N is a home located in Hennepin County with nearby schools including Fernbrook Elementary School, Osseo Middle School, and Maple Grove Senior High School.
Ownership History
Date
Name
Owned For
Owner Type
Purchase Details
Closed on
May 16, 2017
Sold by
Kennedy Kathie D and Kennedy David L
Bought by
Ivanov Yuri and Ivanov Alla
Current Estimated Value
Home Financials for this Owner
Home Financials are based on the most recent Mortgage that was taken out on this home.
Original Mortgage
$254,799
Outstanding Balance
$209,831
Interest Rate
3.75%
Mortgage Type
FHA
Estimated Equity
$186,132
Purchase Details
Closed on
Aug 2, 2011
Sold by
Elfering John R and Elfering Alecia A
Bought by
Kennedy David L and Kennedy Kathie D
Purchase Details
Closed on
May 30, 2006
Sold by
Branger Kevin S and Branger Jennifer M
Bought by
Elfering John R and Sand Alecia A
Purchase Details
Closed on
Aug 27, 2003
Sold by
Tracy Stevend and Hudrick Tracy Trcy A
Bought by
Branger Kevin S and Branger Jennifer M
Purchase Details
Closed on
Mar 9, 2000
Sold by
Beyer Anita J
Bought by
Tracy Steven D and Hudrick Tracy Tracy A
Create a Home Valuation Report for This Property
The Home Valuation Report is an in-depth analysis detailing your home's value as well as a comparison with similar homes in the area
Home Values in the Area
Average Home Value in this Area
Purchase History
| Date | Buyer | Sale Price | Title Company |
|---|---|---|---|
| Ivanov Yuri | $259,500 | Premier Title | |
| Kennedy David L | $200,000 | -- | |
| Elfering John R | $248,500 | -- | |
| Branger Kevin S | $212,000 | -- | |
| Tracy Steven D | $150,000 | -- |
Source: Public Records
Mortgage History
| Date | Status | Borrower | Loan Amount |
|---|---|---|---|
| Open | Ivanov Yuri | $254,799 |
Source: Public Records
Tax History Compared to Growth
Tax History
| Year | Tax Paid | Tax Assessment Tax Assessment Total Assessment is a certain percentage of the fair market value that is determined by local assessors to be the total taxable value of land and additions on the property. | Land | Improvement |
|---|---|---|---|---|
| 2024 | $4,180 | $355,400 | $114,500 | $240,900 |
| 2023 | $4,057 | $350,400 | $107,000 | $243,400 |
| 2022 | $3,457 | $356,600 | $99,500 | $257,100 |
| 2021 | $3,375 | $293,700 | $73,100 | $220,600 |
| 2020 | $3,225 | $283,000 | $68,300 | $214,700 |
| 2019 | $3,205 | $259,300 | $56,200 | $203,100 |
| 2018 | $2,934 | $244,900 | $54,000 | $190,900 |
| 2017 | $3,164 | $216,000 | $57,000 | $159,000 |
| 2016 | $3,093 | $208,200 | $54,000 | $154,200 |
| 2015 | $3,039 | $199,000 | $52,000 | $147,000 |
| 2014 | -- | $179,800 | $47,000 | $132,800 |
Source: Public Records
Map
Nearby Homes
- 9340 Ranchview Ln N
- 10625 Juneau Ln N
- 14624 92nd Place N
- 14661 94th Place N
- 9536 Minnesota Ln N
- 14878 95th Place N
- 14402 91st Place N
- 9421 Dallas Ln N
- 13885 93rd Place N
- 9228 Archer Ln N
- 9190 Archer Ln N
- 9115 Archer Ln N
- 13744 94th Ave N
- 8566 Quarles Rd
- 9138 Comstock Ln N Unit 204
- 9150 Comstock Ln N
- 8858 Comstock Ct
- 13590 89th Ave N
- 9828 Zinnia Ln N
- 8713 Blackoaks Ln N
- 15164 92nd Place N
- 15104 92nd Place N
- 15184 92nd Place N
- 15084 92nd Place N
- 15117 92nd Place N
- 15097 92nd Place N
- 9334 Niagara Ln N
- 15204 92nd Place N
- 15064 92nd Place N
- 15177 92nd Place N
- 15077 92nd Place N
- 9300 Niagara Ln N
- 9240 Orchid Ln N
- 9307 Minnesota Ln N
- 15197 92nd Place N
- 15057 92nd Place N
- 15224 92nd Place N
- 15024 92nd Place N
- 9340 Niagara Ln N
- 9239 Orchid Ln N