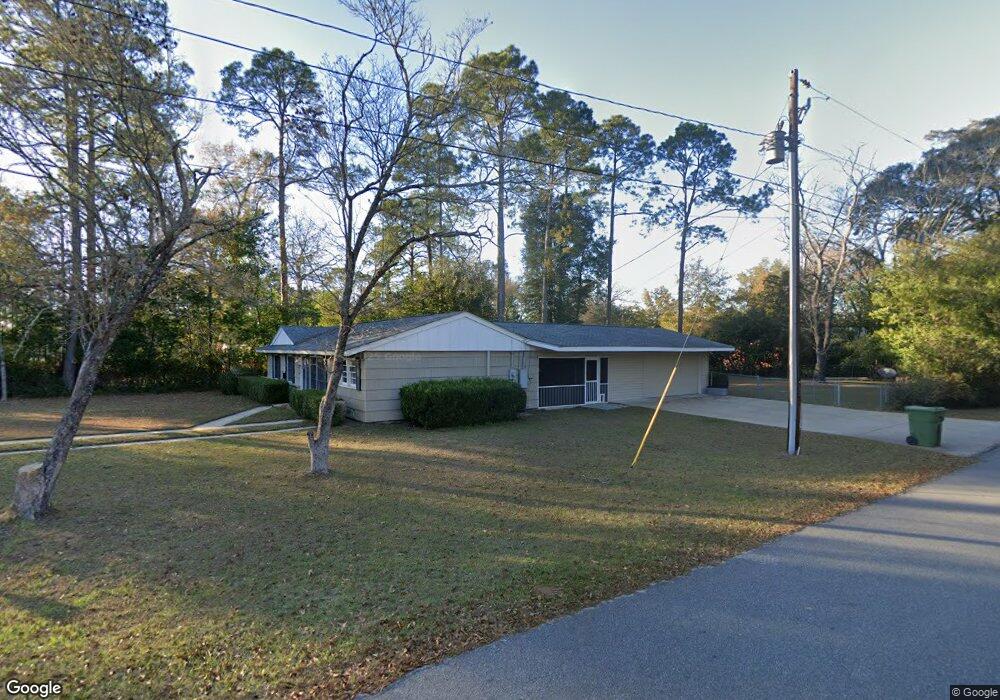
1513 Botts St Bainbridge, GA 39819
Estimated Value: $142,948 - $159,000
3
Beds
2
Baths
1,008
Sq Ft
$151/Sq Ft
Est. Value
About This Home
This home is located at 1513 Botts St, Bainbridge, GA 39819 and is currently estimated at $151,737, approximately $150 per square foot. 1513 Botts St is a home located in Decatur County with nearby schools including Bainbridge High School and Grace Christian Academy.
Ownership History
Date
Name
Owned For
Owner Type
Purchase Details
Closed on
Jul 12, 2013
Sold by
Adamson Edgar D
Bought by
Purcell Joshua C and Purcell Nicole Ann
Current Estimated Value
Home Financials for this Owner
Home Financials are based on the most recent Mortgage that was taken out on this home.
Original Mortgage
$81,632
Outstanding Balance
$59,559
Interest Rate
4%
Mortgage Type
New Conventional
Estimated Equity
$92,178
Purchase Details
Closed on
Jun 23, 2006
Sold by
Harrell Sandra
Bought by
Adamson Edgar D and Adamson Stephens Malissa
Home Financials for this Owner
Home Financials are based on the most recent Mortgage that was taken out on this home.
Original Mortgage
$100,000
Interest Rate
6.55%
Mortgage Type
New Conventional
Purchase Details
Closed on
Feb 9, 2006
Sold by
Reetz Danna A
Bought by
Harrell Sandra
Home Financials for this Owner
Home Financials are based on the most recent Mortgage that was taken out on this home.
Original Mortgage
$29,447
Interest Rate
6.08%
Mortgage Type
New Conventional
Purchase Details
Closed on
Sep 29, 2005
Sold by
Stevens Janice J
Bought by
Reetz Richard L and Reetz Danna A
Create a Home Valuation Report for This Property
The Home Valuation Report is an in-depth analysis detailing your home's value as well as a comparison with similar homes in the area
Home Values in the Area
Average Home Value in this Area
Purchase History
| Date | Buyer | Sale Price | Title Company |
|---|---|---|---|
| Purcell Joshua C | $80,000 | -- | |
| Adamson Edgar D | $125,000 | -- | |
| Harrell Sandra | $112,000 | -- | |
| Reetz Richard L | $60,000 | -- |
Source: Public Records
Mortgage History
| Date | Status | Borrower | Loan Amount |
|---|---|---|---|
| Open | Purcell Joshua C | $81,632 | |
| Previous Owner | Adamson Edgar D | $100,000 | |
| Previous Owner | Harrell Sandra | $29,447 |
Source: Public Records
Tax History Compared to Growth
Tax History
| Year | Tax Paid | Tax Assessment Tax Assessment Total Assessment is a certain percentage of the fair market value that is determined by local assessors to be the total taxable value of land and additions on the property. | Land | Improvement |
|---|---|---|---|---|
| 2024 | $1,050 | $34,992 | $3,574 | $31,418 |
| 2023 | $561 | $34,992 | $3,574 | $31,418 |
| 2022 | $963 | $32,986 | $3,574 | $29,412 |
| 2021 | $902 | $30,238 | $3,574 | $26,664 |
| 2020 | $833 | $26,662 | $3,574 | $23,088 |
| 2019 | $826 | $25,534 | $3,574 | $21,960 |
| 2018 | $816 | $25,534 | $3,574 | $21,960 |
| 2017 | $831 | $23,771 | $3,552 | $20,219 |
| 2016 | $771 | $23,771 | $3,552 | $20,219 |
| 2015 | $794 | $23,771 | $3,552 | $20,219 |
| 2014 | $737 | $23,771 | $3,552 | $20,219 |
| 2013 | -- | $24,014 | $3,552 | $20,462 |
Source: Public Records
Map
Nearby Homes
- 1511 Woodland Dr
- 1504 Woodland Dr
- 1606 Twin Lakes Dr
- 1604 Twin Lakes Dr
- 1600 Dogwood Dr
- 1602 Twin Lakes Dr
- 1103 Stewart Ave
- 1014 Morningside Dr
- 703 S Boulevard Dr
- 1901 Douglas Dr
- 1715 Douglas Dr
- 1512 Douglas Dr
- 1106 E Pine St
- 1402 Pineland Dr
- 606 Chason St
- 904 Parham Ln
- 1505 E Water St
- 1702 Culbreth St
- 809 S Lamar St
- 401 S Sims St
- 1513 Botts Dr
- 1511 Botts Dr
- 955 Gordon Ave
- 1509 Botts Dr
- 1512 Botts Dr
- 951 Gordon Ave
- 1510 Botts Dr
- 1512 E College St
- 959 Gordon Ave
- 1510 E College St
- 1600 E College St
- 1508 Botts Dr
- 1507 Botts Dr
- 1508 E College St
- 1602 E College St
- 1506 Botts Dr
- 1506 E College St
- 1505 Botts Dr
- 1604 E College St
- 1504 Botts Dr