Estimated Value: $165,000 - $317,000
2
Beds
3
Baths
1,088
Sq Ft
$197/Sq Ft
Est. Value
About This Home
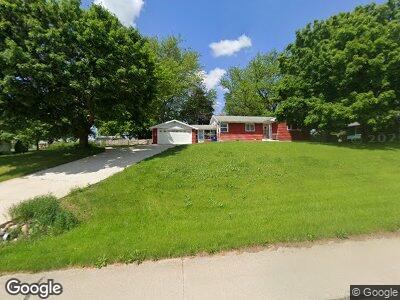
This home is located at 1513 G St, Amana, IA 52203 and is currently estimated at $214,856, approximately $197 per square foot. 1513 G St is a home located in Iowa County with nearby schools including Clear Creek Amana High School.
Ownership History
Date
Name
Owned For
Owner Type
Purchase Details
Closed on
Aug 10, 2018
Sold by
Hill Cole R and Hill Cole Robert
Bought by
Rsm Properties Lc
Current Estimated Value
Home Financials for this Owner
Home Financials are based on the most recent Mortgage that was taken out on this home.
Original Mortgage
$172,000
Outstanding Balance
$143,248
Interest Rate
4.5%
Mortgage Type
Future Advance Clause Open End Mortgage
Estimated Equity
$62,301
Purchase Details
Closed on
Aug 17, 2012
Sold by
Hill Amanda R
Bought by
Hill Cole R
Home Financials for this Owner
Home Financials are based on the most recent Mortgage that was taken out on this home.
Original Mortgage
$36,000
Interest Rate
3.57%
Mortgage Type
New Conventional
Create a Home Valuation Report for This Property
The Home Valuation Report is an in-depth analysis detailing your home's value as well as a comparison with similar homes in the area
Home Values in the Area
Average Home Value in this Area
Purchase History
| Date | Buyer | Sale Price | Title Company |
|---|---|---|---|
| Rsm Properties Lc | $172,000 | None Available | |
| Hill Cole R | -- | None Available |
Source: Public Records
Mortgage History
| Date | Status | Borrower | Loan Amount |
|---|---|---|---|
| Open | Rsm Properties Lc | $172,000 | |
| Previous Owner | Hill Cole R | $36,000 | |
| Previous Owner | Hill Cole R | $92,885 | |
| Previous Owner | Hill Cole R | $36,000 | |
| Previous Owner | Hill Cole R | $104,000 | |
| Previous Owner | Hill Cole R | $6,085 | |
| Previous Owner | Hill Cole R | $82,500 | |
| Previous Owner | Hill Cole R | $27,500 |
Source: Public Records
Tax History Compared to Growth
Tax History
| Year | Tax Paid | Tax Assessment Tax Assessment Total Assessment is a certain percentage of the fair market value that is determined by local assessors to be the total taxable value of land and additions on the property. | Land | Improvement |
|---|---|---|---|---|
| 2024 | $2,010 | $143,280 | $26,430 | $116,850 |
| 2023 | $2,056 | $143,280 | $26,430 | $116,850 |
| 2022 | $2,016 | $125,750 | $26,430 | $99,320 |
| 2021 | $1,914 | $125,750 | $26,430 | $99,320 |
| 2020 | $1,876 | $112,690 | $24,230 | $88,460 |
| 2019 | $1,756 | $112,690 | $24,230 | $88,460 |
| 2018 | $1,696 | $103,760 | $22,020 | $81,740 |
| 2017 | $1,726 | $103,760 | $22,020 | $81,740 |
| 2016 | $1,712 | $103,490 | $22,020 | $81,470 |
| 2015 | $1,712 | $103,490 | $22,020 | $81,470 |
| 2014 | $1,634 | $101,200 | $22,020 | $79,180 |
Source: Public Records