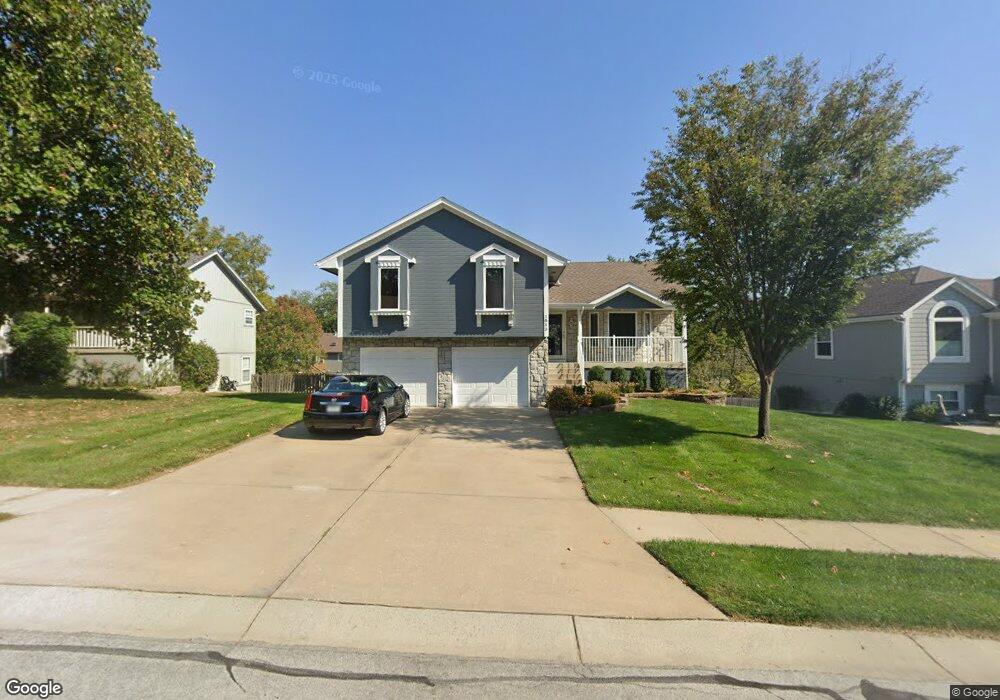
1513 NE Jade St Lees Summit, MO 64086
Estimated Value: $305,331 - $351,000
3
Beds
3
Baths
1,450
Sq Ft
$231/Sq Ft
Est. Value
About This Home
This home is located at 1513 NE Jade St, Lees Summit, MO 64086 and is currently estimated at $335,583, approximately $231 per square foot. 1513 NE Jade St is a home located in Jackson County with nearby schools including Underwood Elementary School, Bernard C. Campbell Middle School, and Lee's Summit North High School.
Ownership History
Date
Name
Owned For
Owner Type
Purchase Details
Closed on
May 29, 2018
Sold by
Chipman William R and Chipman Marsha M
Bought by
William And Marsha Chipman Revocable Tru
Current Estimated Value
Purchase Details
Closed on
Feb 17, 2004
Sold by
Wilcoxen Timothy L and Wilcoxen Lori D
Bought by
Chipman William R and Chipman Marsha M
Home Financials for this Owner
Home Financials are based on the most recent Mortgage that was taken out on this home.
Original Mortgage
$118,000
Outstanding Balance
$55,457
Interest Rate
5.86%
Mortgage Type
Purchase Money Mortgage
Estimated Equity
$280,126
Purchase Details
Closed on
Jan 7, 2003
Sold by
Richardson Ranch Llc
Bought by
Wilcoxen Timothy L and Wilcoxen Lori D
Home Financials for this Owner
Home Financials are based on the most recent Mortgage that was taken out on this home.
Original Mortgage
$340,000
Interest Rate
5.96%
Mortgage Type
Construction
Create a Home Valuation Report for This Property
The Home Valuation Report is an in-depth analysis detailing your home's value as well as a comparison with similar homes in the area
Home Values in the Area
Average Home Value in this Area
Purchase History
| Date | Buyer | Sale Price | Title Company |
|---|---|---|---|
| William And Marsha Chipman Revocable Tru | -- | None Available | |
| Chipman William R | -- | Security Land Title Company | |
| Wilcoxen Timothy L | -- | Stewart Title Of Kansas City |
Source: Public Records
Mortgage History
| Date | Status | Borrower | Loan Amount |
|---|---|---|---|
| Open | Chipman William R | $118,000 | |
| Previous Owner | Wilcoxen Timothy L | $340,000 |
Source: Public Records
Tax History
| Year | Tax Paid | Tax Assessment Tax Assessment Total Assessment is a certain percentage of the fair market value that is determined by local assessors to be the total taxable value of land and additions on the property. | Land | Improvement |
|---|---|---|---|---|
| 2025 | $3,303 | $45,982 | $7,492 | $38,490 |
| 2024 | $3,279 | $45,750 | $5,863 | $39,887 |
| 2023 | $3,279 | $45,750 | $5,911 | $39,839 |
| 2022 | $2,807 | $34,770 | $5,966 | $28,804 |
| 2021 | $2,865 | $34,770 | $5,966 | $28,804 |
| 2020 | $2,707 | $32,536 | $5,966 | $26,570 |
| 2019 | $2,633 | $32,536 | $5,966 | $26,570 |
| 2018 | $2,600 | $29,815 | $4,423 | $25,392 |
| 2017 | $2,600 | $29,815 | $4,423 | $25,392 |
| 2016 | $2,598 | $29,488 | $4,237 | $25,251 |
Source: Public Records
Map
Nearby Homes
- 1541 NE Neawanna Dr
- 1401 NE Ernest Way
- 1133 NE Mulberry St
- 1141 NE Hunters Ridge
- 1118 NE Deerbrook Terrace
- 1717 NE Luther Rd
- 1213 NE Ball Dr
- 1104 NE Country Ln
- 1108 NE Colleen Dr
- 1616 NE Bluff St
- 1700 NE Bluff St
- 1708 NE Bluff St
- 1704 NE Bluff St
- 1029 NE Brookfield Dr
- 1028 NE Brookfield Dr
- 812 NE Mulberry St
- 905 NE Country Ln
- 809 NE Cedar St
- 1000 NE Brookfield Dr
- 816 NE Pollard St
- 1517 NE Jade St
- 1509 NE Jade St
- 1516 NE Jade St
- 1512 NE Jade St
- 1521 NE Jade St
- 1505 NE Jade St
- 1520 NE Jade St
- 1508 NE Jade St
- 1528 NE Tawny Dr
- 1532 NE Tawny Dr
- 1525 NE Jade St
- 1524 NE Jade St
- 1504 NE Jade St
- 1520 NE Tawny Dr
- 1536 NE Tawny Dr
- 1501 NE Jade St
- 1540 NE Tawny Dr
- 1529 NE Jade St
- 1529 NE Tawny Dr
- 1533 NE Tawny Dr
Your Personal Tour Guide
Ask me questions while you tour the home.