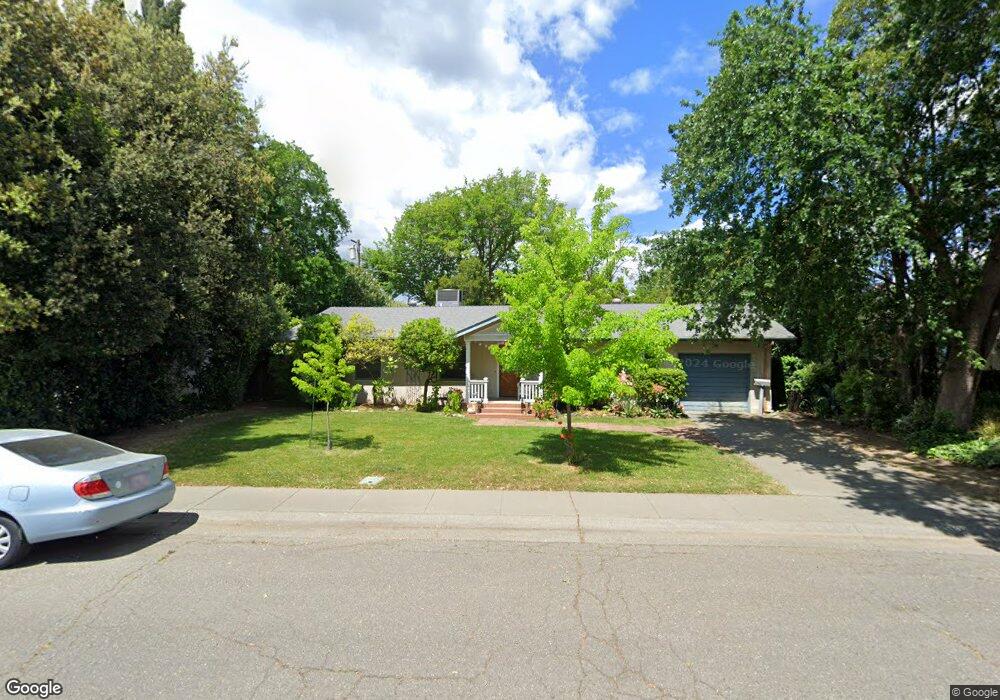
1513 Tulane Dr Davis, CA 95616
East Davis NeighborhoodEstimated Value: $600,000 - $756,142
4
Beds
2
Baths
1,679
Sq Ft
$421/Sq Ft
Est. Value
About This Home
This home is located at 1513 Tulane Dr, Davis, CA 95616 and is currently estimated at $707,286, approximately $421 per square foot. 1513 Tulane Dr is a home located in Yolo County with nearby schools including Birch Lane Elementary School, Oliver Wendell Holmes Junior High School, and Davis Senior High School.
Ownership History
Date
Name
Owned For
Owner Type
Purchase Details
Closed on
Sep 27, 2023
Sold by
Scott Linda M
Bought by
Scott Living Trust and Scott
Current Estimated Value
Purchase Details
Closed on
Jun 8, 1999
Sold by
Auclair Philippe and Auclair Marguerite
Bought by
Scott Linda M
Home Financials for this Owner
Home Financials are based on the most recent Mortgage that was taken out on this home.
Original Mortgage
$140,000
Interest Rate
7.05%
Create a Home Valuation Report for This Property
The Home Valuation Report is an in-depth analysis detailing your home's value as well as a comparison with similar homes in the area
Home Values in the Area
Average Home Value in this Area
Purchase History
| Date | Buyer | Sale Price | Title Company |
|---|---|---|---|
| Scott Living Trust | -- | None Listed On Document | |
| Scott Linda M | $240,000 | North American Title Guarant |
Source: Public Records
Mortgage History
| Date | Status | Borrower | Loan Amount |
|---|---|---|---|
| Previous Owner | Scott Linda M | $140,000 |
Source: Public Records
Tax History
| Year | Tax Paid | Tax Assessment Tax Assessment Total Assessment is a certain percentage of the fair market value that is determined by local assessors to be the total taxable value of land and additions on the property. | Land | Improvement |
|---|---|---|---|---|
| 2025 | $4,520 | $376,224 | $117,565 | $258,659 |
| 2023 | $4,520 | $361,616 | $113,000 | $248,616 |
| 2022 | $4,339 | $354,527 | $110,785 | $243,742 |
| 2021 | $4,247 | $347,576 | $108,613 | $238,963 |
| 2020 | $4,182 | $344,013 | $107,500 | $236,513 |
| 2019 | $3,911 | $337,269 | $105,393 | $231,876 |
| 2018 | $3,630 | $330,657 | $103,327 | $227,330 |
| 2017 | $3,559 | $324,174 | $101,301 | $222,873 |
| 2016 | $3,496 | $317,818 | $99,315 | $218,503 |
| 2015 | $3,364 | $313,045 | $97,824 | $215,221 |
| 2014 | $3,364 | $306,914 | $95,908 | $211,006 |
Source: Public Records
Map
Nearby Homes
Your Personal Tour Guide
Ask me questions while you tour the home.