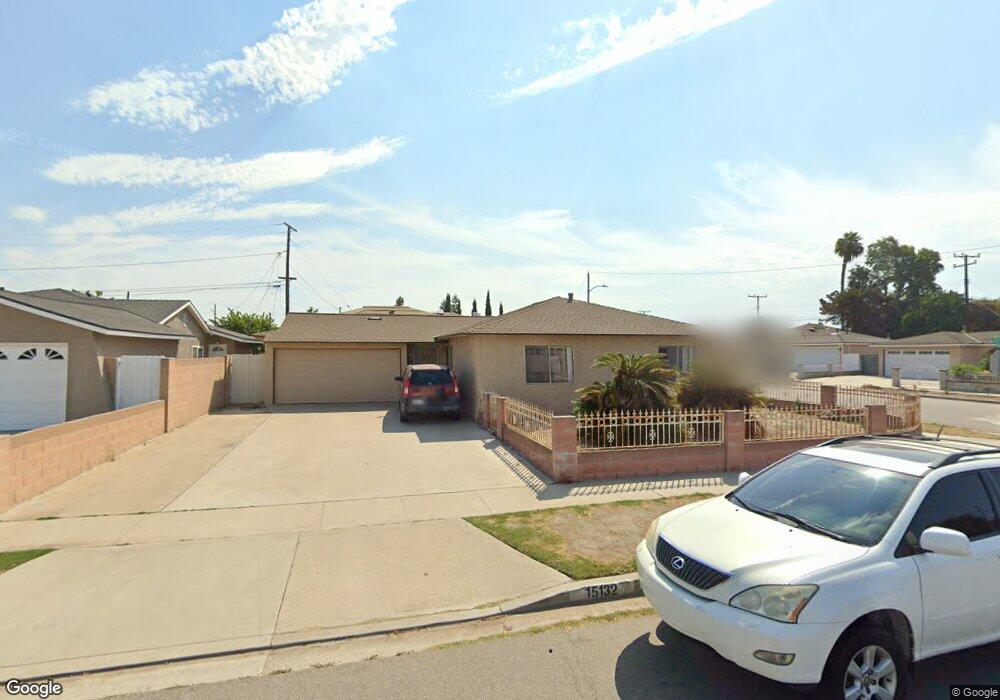
15132 Hunter Ln Westminster, CA 92683
Star View NeighborhoodEstimated Value: $911,000 - $1,011,000
3
Beds
2
Baths
1,264
Sq Ft
$764/Sq Ft
Est. Value
About This Home
This home is located at 15132 Hunter Ln, Westminster, CA 92683 and is currently estimated at $965,781, approximately $764 per square foot. 15132 Hunter Ln is a home located in Orange County with nearby schools including Demille Elementary, Warner Middle, and Westminster High School.
Ownership History
Date
Name
Owned For
Owner Type
Purchase Details
Closed on
Jun 24, 2021
Sold by
Tran Steven and Tse Kiu Min
Bought by
Tran Steven and Tran Ki Ming
Current Estimated Value
Purchase Details
Closed on
Aug 11, 1998
Sold by
Fragosa Tamiye
Bought by
Tran Steven and Tse Kiu Mino
Home Financials for this Owner
Home Financials are based on the most recent Mortgage that was taken out on this home.
Original Mortgage
$89,900
Interest Rate
6.88%
Purchase Details
Closed on
Aug 28, 1997
Sold by
Fragosa Tamiye
Bought by
Fragosa Tamiye and The Tamiye Fragosa Trust
Purchase Details
Closed on
Aug 27, 1997
Sold by
Fragosa Gilbert M & Tamiye Trust and Tamiye
Bought by
Fragosa Tamiye
Purchase Details
Closed on
Aug 15, 1997
Sold by
Fragosa Gilbert M & Tamiye Fragosa Trust
Bought by
Fragosa Tamiye and Gilbert M & Tamiye Fragosa Trust
Create a Home Valuation Report for This Property
The Home Valuation Report is an in-depth analysis detailing your home's value as well as a comparison with similar homes in the area
Home Values in the Area
Average Home Value in this Area
Purchase History
| Date | Buyer | Sale Price | Title Company |
|---|---|---|---|
| Tran Steven | -- | None Available | |
| Tran Steven | -- | None Available | |
| Tran Steven | $160,000 | Benefit Land Title Company | |
| Fragosa Tamiye | -- | -- | |
| Fragosa Tamiye | -- | -- | |
| Fragosa Tamiye | -- | -- |
Source: Public Records
Mortgage History
| Date | Status | Borrower | Loan Amount |
|---|---|---|---|
| Previous Owner | Tran Steven | $89,900 |
Source: Public Records
Tax History
| Year | Tax Paid | Tax Assessment Tax Assessment Total Assessment is a certain percentage of the fair market value that is determined by local assessors to be the total taxable value of land and additions on the property. | Land | Improvement |
|---|---|---|---|---|
| 2025 | $5,643 | $408,691 | $182,601 | $226,090 |
| 2024 | $5,643 | $400,678 | $179,021 | $221,657 |
| 2023 | $4,776 | $330,933 | $175,511 | $155,422 |
| 2022 | $3,545 | $236,209 | $172,069 | $64,140 |
| 2021 | $3,171 | $231,578 | $168,695 | $62,883 |
| 2020 | $3,136 | $229,204 | $166,965 | $62,239 |
| 2019 | $3,106 | $224,710 | $163,691 | $61,019 |
| 2018 | $3,104 | $220,304 | $160,481 | $59,823 |
| 2017 | $2,998 | $215,985 | $157,335 | $58,650 |
| 2016 | $2,913 | $211,750 | $154,250 | $57,500 |
| 2015 | $2,867 | $208,570 | $151,933 | $56,637 |
| 2014 | $2,807 | $204,485 | $148,957 | $55,528 |
Source: Public Records
Map
Nearby Homes
- 15065 Henley Dr Unit 1
- 15110 Henley Dr Unit 51
- 15281 Dogwood St
- 8200 Bolsa Ave Unit 3
- 8200 Bolsa Ave Unit 166
- 8200 Bolsa Ave Unit 42
- 8200 Bolsa Ave Unit 103
- 8200 Bolsa Ave Spc#146
- 9172 Chelsea Cir
- 9202 Dickens Cir
- 15081 Van Buren St
- 15121 Van Buren St
- 19 Sorbonne St
- 14972 Beach Blvd
- 8412 Sterling Way
- 15942 Topaz St
- 8028 Worthy Dr
- 9561 Cardinal Ave
- 15141 Beach Blvd Unit 44
- 7901 Rockwell Ave
- 15112 Hunter Ln
- 15131 Eden St
- 15111 Eden St
- 15102 Hunter Ln
- 8712 Elvira Ave
- 8732 Elvira Ave
- 15101 Eden St
- 15131 Hunter Ln
- 15111 Hunter Ln
- 15092 Hunter Ln
- 8742 Elvira Ave
- 15101 Hunter Ln
- 8692 Elvira Ave
- 15091 Eden St
- 8752 Elvira Ave
- 15182 Hunter Ln
- 15091 Hunter Ln
- 15082 Hunter Ln
- 8672 Elvira Ave
- 15132 Eden St