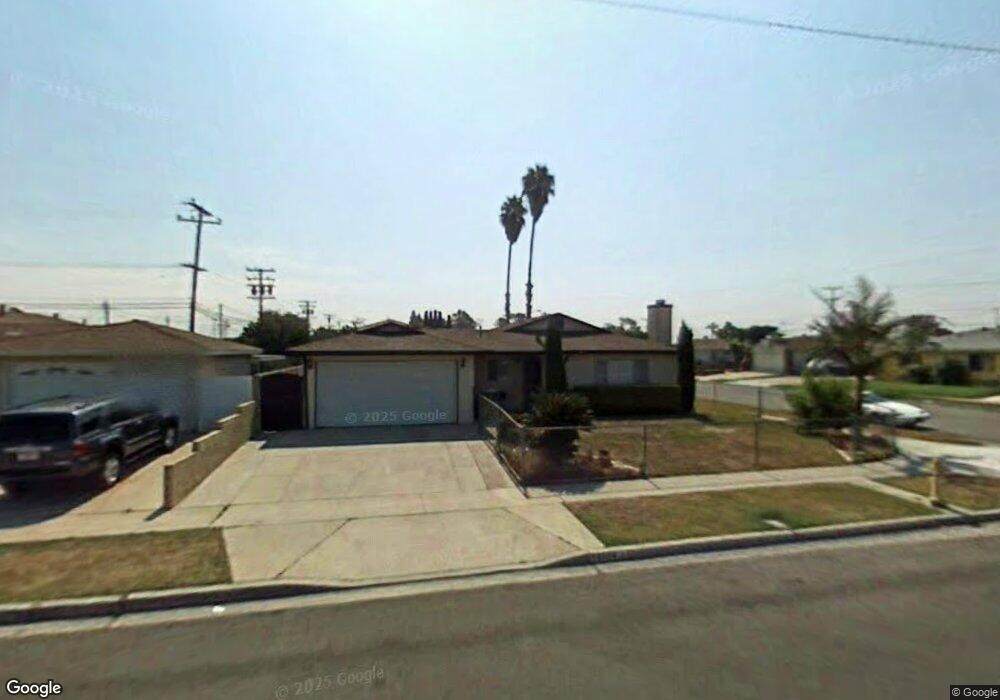
15132 Neece St Westminster, CA 92683
Star View NeighborhoodEstimated Value: $879,000 - $940,000
3
Beds
2
Baths
1,226
Sq Ft
$746/Sq Ft
Est. Value
About This Home
This home is located at 15132 Neece St, Westminster, CA 92683 and is currently estimated at $914,042, approximately $745 per square foot. 15132 Neece St is a home located in Orange County with nearby schools including Demille Elementary, Warner Middle, and Westminster High School.
Ownership History
Date
Name
Owned For
Owner Type
Purchase Details
Closed on
Jan 14, 2021
Sold by
Nguyen Kevin and Nguyen Hang Thu
Bought by
Nguyen Kevin and Nguyen Hang
Current Estimated Value
Purchase Details
Closed on
May 15, 2006
Sold by
Nguyen Kevin K
Bought by
Nguyen Kevin and Nguyen Hang
Purchase Details
Closed on
Apr 9, 2003
Sold by
Nguyen Hang Thy
Bought by
Nguyen Kevin
Purchase Details
Closed on
Jan 27, 2003
Sold by
Benson John P and Benson Julieann
Bought by
Nguyen Kevin
Home Financials for this Owner
Home Financials are based on the most recent Mortgage that was taken out on this home.
Original Mortgage
$280,000
Interest Rate
5.6%
Purchase Details
Closed on
Jun 7, 1994
Sold by
Wilk Margaret L
Bought by
Benson John P and Benson Julieann
Home Financials for this Owner
Home Financials are based on the most recent Mortgage that was taken out on this home.
Original Mortgage
$154,908
Interest Rate
8.25%
Mortgage Type
FHA
Create a Home Valuation Report for This Property
The Home Valuation Report is an in-depth analysis detailing your home's value as well as a comparison with similar homes in the area
Home Values in the Area
Average Home Value in this Area
Purchase History
| Date | Buyer | Sale Price | Title Company |
|---|---|---|---|
| Nguyen Kevin | -- | Ticor Title Company Of Ca | |
| Nguyen Kevin | -- | Ticor Title Company Of Ca | |
| Nguyen Kevin | -- | None Available | |
| Nguyen Kevin | -- | Commonwealth Land Title | |
| Nguyen Kevin | $355,500 | Commonwealth Land Title | |
| Benson John P | $158,500 | Stewart Title |
Source: Public Records
Mortgage History
| Date | Status | Borrower | Loan Amount |
|---|---|---|---|
| Previous Owner | Nguyen Kevin | $280,000 | |
| Previous Owner | Benson John P | $154,908 |
Source: Public Records
Tax History
| Year | Tax Paid | Tax Assessment Tax Assessment Total Assessment is a certain percentage of the fair market value that is determined by local assessors to be the total taxable value of land and additions on the property. | Land | Improvement |
|---|---|---|---|---|
| 2025 | $6,307 | $514,873 | $440,689 | $74,184 |
| 2024 | $6,307 | $504,778 | $432,048 | $72,730 |
| 2023 | $6,094 | $494,881 | $423,577 | $71,304 |
| 2022 | $6,000 | $485,178 | $415,272 | $69,906 |
| 2021 | $5,854 | $475,665 | $407,129 | $68,536 |
| 2020 | $5,786 | $470,788 | $402,954 | $67,834 |
| 2019 | $5,723 | $461,557 | $395,053 | $66,504 |
| 2018 | $5,723 | $452,507 | $387,307 | $65,200 |
| 2017 | $5,511 | $443,635 | $379,713 | $63,922 |
| 2016 | $5,341 | $434,937 | $372,268 | $62,669 |
| 2015 | $5,252 | $428,404 | $366,676 | $61,728 |
| 2014 | $5,136 | $420,013 | $359,494 | $60,519 |
Source: Public Records
Map
Nearby Homes
- 15065 Henley Dr Unit 1
- 15110 Henley Dr Unit 51
- 15300 Magnolia St Unit 82
- 15300 Magnolia St
- 9031 Washington Ave
- 8200 Bolsa Ave Unit 166
- 8200 Bolsa Ave Unit 42
- 8200 Bolsa Ave Unit 103
- 14642 Birch St
- 19 Sorbonne St
- 8200 Bolsa Ave Spc#146
- 15081 Van Buren St
- 15121 Van Buren St
- 14372 Janice St
- 9561 Cardinal Ave
- 8412 Sterling Way
- 15942 Topaz St
- 14972 Beach Blvd
- 14331 Riata St
- 8172 Hazard Ave
- 15112 Neece St
- 8841 Elvira Ave
- 15102 Neece St
- 8822 Elvira Ave
- 8812 Elvira Ave
- 8851 Elvira Ave
- 15131 Neece St
- 8842 Elvira Ave
- 15111 Neece St
- 8802 Elvira Ave
- 15092 Neece St
- 8852 Elvira Ave
- 15101 Neece St
- 8861 Elvira Ave
- 8792 Elvira Ave
- 15091 Neece St
- 8821 Montrose Ave
- 15082 Neece St
- 8862 Elvira Ave
- 8811 Montrose Ave
Your Personal Tour Guide
Ask me questions while you tour the home.