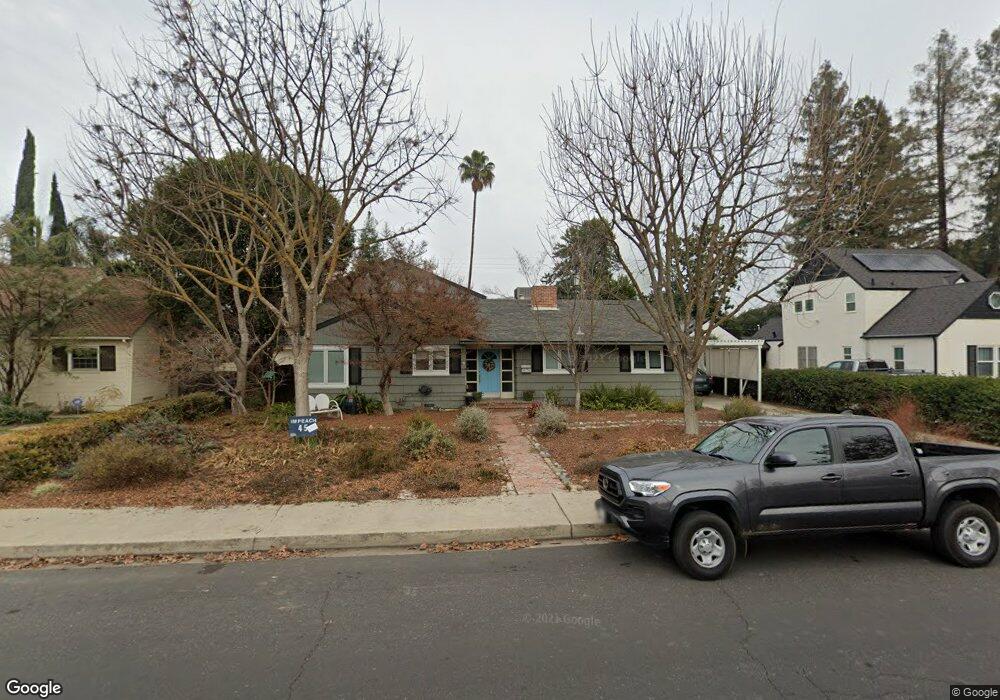
1514 W Kaweah Ave Visalia, CA 93277
South Visalia NeighborhoodEstimated Value: $482,889 - $557,000
4
Beds
3
Baths
2,578
Sq Ft
$207/Sq Ft
Est. Value
About This Home
This home is located at 1514 W Kaweah Ave, Visalia, CA 93277 and is currently estimated at $532,722, approximately $206 per square foot. 1514 W Kaweah Ave is a home located in Tulare County with nearby schools including Divisadero Middle School, Mt. Whitney High School, and Visalia Charter Independent Study - East Campus.
Ownership History
Date
Name
Owned For
Owner Type
Purchase Details
Closed on
Mar 28, 2025
Sold by
Raish Elva and Reynolds James
Bought by
Elva Elaine Raish And James Paul Reynolds Liv and Reynolds
Current Estimated Value
Purchase Details
Closed on
Nov 17, 1998
Sold by
Castro Chris E
Bought by
Reynolds James and Raish Elva
Home Financials for this Owner
Home Financials are based on the most recent Mortgage that was taken out on this home.
Original Mortgage
$157,600
Interest Rate
6.63%
Purchase Details
Closed on
Oct 20, 1997
Sold by
Bartys Anthony Peter
Bought by
Castro Chris E and Castro Cari Anne
Home Financials for this Owner
Home Financials are based on the most recent Mortgage that was taken out on this home.
Original Mortgage
$156,400
Interest Rate
7.23%
Create a Home Valuation Report for This Property
The Home Valuation Report is an in-depth analysis detailing your home's value as well as a comparison with similar homes in the area
Home Values in the Area
Average Home Value in this Area
Purchase History
| Date | Buyer | Sale Price | Title Company |
|---|---|---|---|
| Elva Elaine Raish And James Paul Reynolds Liv | -- | None Listed On Document | |
| Reynolds James | $197,000 | Chicago Title Co | |
| Castro Chris E | $170,000 | -- |
Source: Public Records
Mortgage History
| Date | Status | Borrower | Loan Amount |
|---|---|---|---|
| Previous Owner | Reynolds James | $157,600 | |
| Previous Owner | Castro Chris E | $156,400 |
Source: Public Records
Tax History Compared to Growth
Tax History
| Year | Tax Paid | Tax Assessment Tax Assessment Total Assessment is a certain percentage of the fair market value that is determined by local assessors to be the total taxable value of land and additions on the property. | Land | Improvement |
|---|---|---|---|---|
| 2025 | $3,253 | $308,848 | $70,547 | $238,301 |
| 2024 | $3,253 | $302,793 | $69,164 | $233,629 |
| 2023 | $3,164 | $296,857 | $67,808 | $229,049 |
| 2022 | $3,023 | $291,037 | $66,479 | $224,558 |
| 2021 | $3,027 | $285,330 | $65,175 | $220,155 |
| 2020 | $3,007 | $282,405 | $64,507 | $217,898 |
| 2019 | $2,915 | $276,867 | $63,242 | $213,625 |
| 2018 | $2,847 | $271,438 | $62,002 | $209,436 |
| 2017 | $2,812 | $266,115 | $60,786 | $205,329 |
| 2016 | $2,765 | $260,897 | $59,594 | $201,303 |
| 2015 | $2,612 | $256,978 | $58,699 | $198,279 |
| 2014 | $2,612 | $245,000 | $61,000 | $184,000 |
Source: Public Records
Map
Nearby Homes
- 621 S Divisadero St
- 1301 W Beverly Dr
- 1421 W Oak Ave
- 1321 W Oak Ave
- 1107 W Westcott Ave
- 602 S Conyer St
- 313 N Giddings St
- 1315 S Conyer St
- 526 W Myrtle Ave
- 704 N Divisadero St
- 1608 S Central St
- 1419 S Crowe St
- 1640 W Princeton Ct
- 1406 W Princeton Ave
- 1518 W Grove Ave
- 1330 S Clover St
- 1103 S Linda Vista St
- 2419 W Harvard Ave
- 825 N Divisadero St
- 733 W Paradise Ave
- 1510 W Kaweah Ave
- 1516 W Kaweah Ave
- 1513 W Noble Ave
- 1508 W Kaweah Ave
- 1520 W Kaweah Ave
- 1511 W Noble Ave
- 1517 W Noble Ave
- 1515 W Kaweah Ave
- 1509 W Noble Ave
- 504 S Divisadero St
- 1517 W Kaweah Ave
- 1504 W Kaweah Ave
- 1509 W Kaweah Ave
- 1519 W Kaweah Ave
- 1505 W Noble Ave
- 1505 W Kaweah Ave
- 1500 W Kaweah Ave
- 1501 W Noble Ave
- 513 S Divisadero St
- 1512 W Myrtle Ave