
Seller's Agent in 2026
Corinna Bandemer
Compass - Denver
(720) 530-8660
1 in this area
34 Total Sales
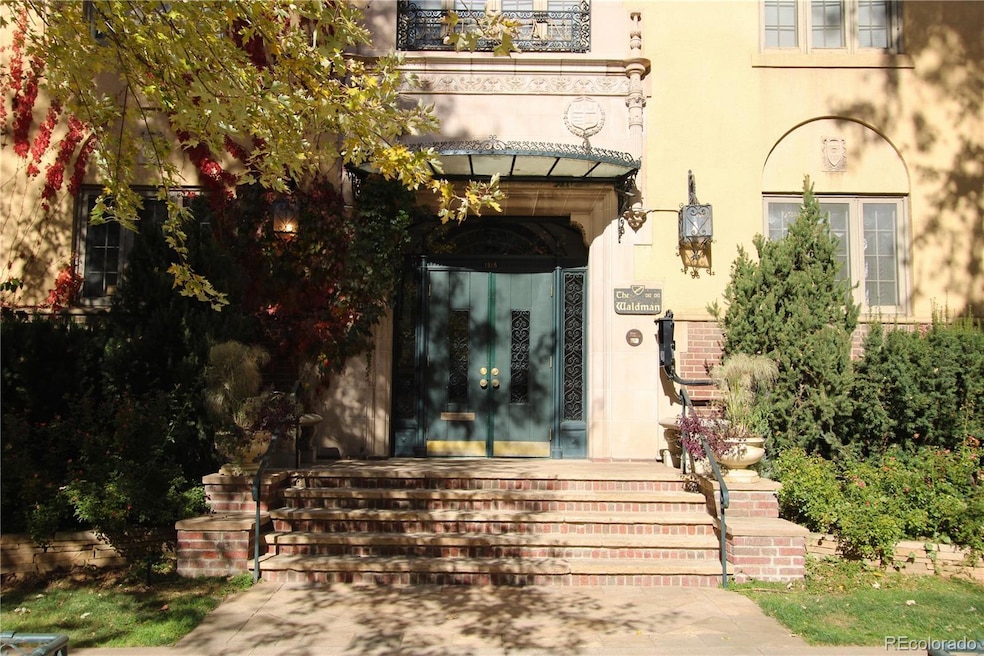
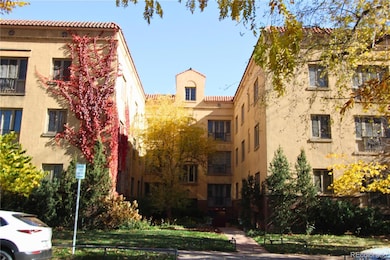
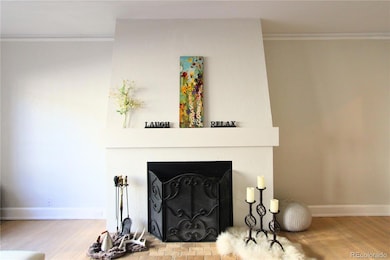
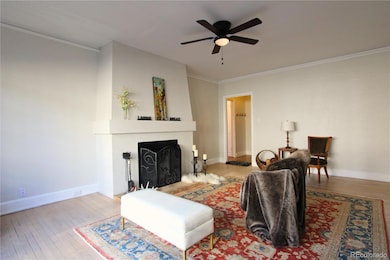
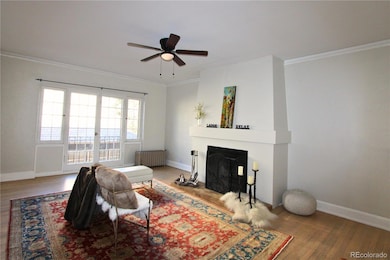
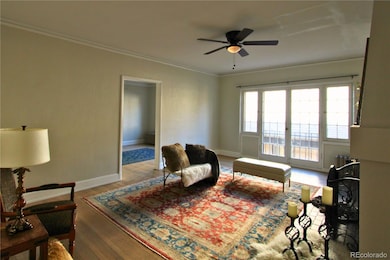
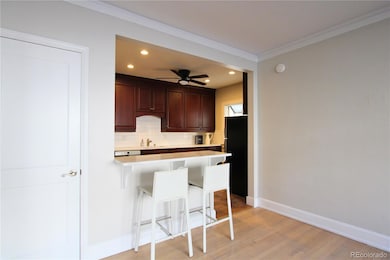
Nestled just steps from the lush lawns and walking paths of Cheesman Park, The Waldman is a timeless architectural gem that blends historic charm with refined sophistication. Built in 1923 by prestigious Denver architects Fisher & Fisher, this European-inspired condominium features original Art Deco details — including soaring ceilings, wide hallways, stained glass, and Juliet balconies — all woven seamlessly into modern, thoughtfully upgraded living spaces. Condo 310 has been freshly painted and has beautiful hardwood floors throughout. The large main living space has a wood burning fireplace and a wall of windows. In addition, the dining area is very spacious and could also be used as a bright office area. There are new Quartz countertops in the large kitchen with island seating, a gas stove and a pantry. Four new ceiling fans have been put in. The primary bedroom is spacious with a walk in closet and a row of storage space/closet area in the hallway. A smaller bonus room could be used for office, workout, extra closet, etc. This is a lovely condo waiting for its next owners to enjoy or maybe as an investment for someone. It has a successful rental history. It is walking distance to the Denver Botanic Gardens, top dining, shopping, and cultural hotspots. With its storied past and vibrant present, The Waldman offers a rare opportunity to live in a piece of Denver’s architectural heritage — beautifully preserved, yet thoroughly contemporary.
Last Agent to Sell the Property
Compass - Denver Brokerage Email: Corinna.bandemer@compass.com,720-530-8660 License #40029869 Listed on: 11/14/2025
| Date | Type | Sale Price | Title Company |
|---|---|---|---|
| Warranty Deed | $437,500 | Heritage Title | |
| Quit Claim Deed | -- | None Listed On Document | |
| Warranty Deed | $325,000 | Stewart Title | |
| Quit Claim Deed | -- | None Available | |
| Warranty Deed | $220,000 | Land Title | |
| Interfamily Deed Transfer | -- | -- | |
| Warranty Deed | $169,000 | -- | |
| Interfamily Deed Transfer | -- | -- |
| Date | Event | Price | List to Sale | Price per Sq Ft |
|---|---|---|---|---|
| 02/12/2026 02/12/26 | Sold | $437,500 | -7.9% | $366 / Sq Ft |
| 11/14/2025 11/14/25 | For Sale | $475,000 | -- | $398 / Sq Ft |
| Year | Tax Paid | Tax Assessment Tax Assessment Total Assessment is a certain percentage of the fair market value that is determined by local assessors to be the total taxable value of land and additions on the property. | Land | Improvement |
|---|---|---|---|---|
| 2025 | $2,349 | $34,450 | $4,520 | $4,520 |
| 2024 | $2,349 | $29,660 | $3,150 | $26,510 |
| 2023 | $2,298 | $29,660 | $3,150 | $26,510 |
| 2022 | $2,316 | $29,120 | $3,270 | $25,850 |
| 2021 | $2,236 | $29,960 | $3,360 | $26,600 |
| 2020 | $2,089 | $28,160 | $3,140 | $25,020 |
| 2019 | $2,031 | $28,160 | $3,140 | $25,020 |
| 2018 | $1,958 | $25,310 | $2,930 | $22,380 |
| 2017 | $1,952 | $25,310 | $2,930 | $22,380 |
| 2016 | $2,017 | $24,740 | $2,746 | $21,994 |
| 2015 | $1,933 | $24,740 | $2,746 | $21,994 |
| 2014 | $1,588 | $19,120 | $3,399 | $15,721 |
Seller's Agent in 2026
Corinna Bandemer
Compass - Denver
(720) 530-8660
1 in this area
34 Total Sales
Buyer's Agent in 2026
Jill Horch
Thrive Real Estate Group
(720) 704-0793
1 in this area
38 Total Sales
Source: REcolorado®
MLS Number: 4972802
APN: 5023-01-042
Disclaimer: Certain information contained herein is derived from information provided by parties other than Homes.com. All information provided is deemed reliable, but is not guaranteed to be accurate and should be independently verified.
![]() Based on information submitted to the MLS GRID. All data is obtained from various sources and may not have been verified by broker or MLS GRID. Supplied Open House Information is subject to change without notice. All information should be independently reviewed and verified for accuracy. Properties may or may not be listed by the office/agent presenting the information. Some IDX listings have been excluded from this website. The content relating to real estate for sale in this Web site comes in part from the Internet Data eXchange (“IDX”) program of METROLIST, INC., DBA RECOLORADO®. Real estate listings held by brokers other than Ten-X are marked with the IDX Logo. This information is being provided for the consumers’ personal, non-commercial use and may not be used for any other purpose. All information is subject to change and should be independently verified.
Based on information submitted to the MLS GRID. All data is obtained from various sources and may not have been verified by broker or MLS GRID. Supplied Open House Information is subject to change without notice. All information should be independently reviewed and verified for accuracy. Properties may or may not be listed by the office/agent presenting the information. Some IDX listings have been excluded from this website. The content relating to real estate for sale in this Web site comes in part from the Internet Data eXchange (“IDX”) program of METROLIST, INC., DBA RECOLORADO®. Real estate listings held by brokers other than Ten-X are marked with the IDX Logo. This information is being provided for the consumers’ personal, non-commercial use and may not be used for any other purpose. All information is subject to change and should be independently verified.
This publication is designed to provide information with regard to the subject matter covered. It is displayed with the understanding that the publisher and authors are not engaged in rendering real estate, legal, accounting, tax, or other professional services and that the publisher and authors are not offering such advice in this publication. If real estate, legal, or other expert assistance is required, the services of a competent, professional person should be sought.
The information contained in this publication is subject to change without notice. METROLIST, INC., DBA RECOLORADO MAKES NO WARRANTY OF ANY KIND WITH REGARD TO THIS MATERIAL, INCLUDING, BUT NOT LIMITED TO, THE IMPLIED WARRANTIES OF MERCHANTABILITY AND FITNESS FOR A PARTICULAR PURPOSE. METROLIST, INC., DBA RECOLORADO SHALL NOT BE LIABLE FOR ERRORS CONTAINED HEREIN OR FOR ANY DAMAGES IN CONNECTION WITH THE FURNISHING, PERFORMANCE, OR USE OF THIS MATERIAL.
PUBLISHER’S NOTICE: All real estate advertised herein is subject to the Federal Fair Housing Act and the Colorado Fair Housing Act, which Acts make it illegal to make or publish any advertisement that indicates any preference, limitation, or discrimination based on race, color, religion, sex, handicap, familial status, or national origin.
METROLIST, INC., DBA RECOLORADO will not knowingly accept any advertising for real estate that is in violation of the law. All persons are hereby informed that all dwellings advertised are available on an equal opportunity basis.
© 2026 METROLIST, INC., DBA RECOLORADO® – All Rights Reserved. 6455 S. Yosemite St., Suite 500 Greenwood Village, CO 80111 USA
ALL RIGHTS RESERVED WORLDWIDE. No part of this publication may be reproduced, adapted, translated, stored in a retrieval system or transmitted in any form or by any means, electronic, mechanical, photocopying, recording, or otherwise, without the prior written permission of the publisher. The information contained herein including but not limited to all text, photographs, digital images, virtual tours, may be seeded and monitored for protection and tracking.
Based on information submitted to the MLS GRID
Ask me questions while you tour the home.