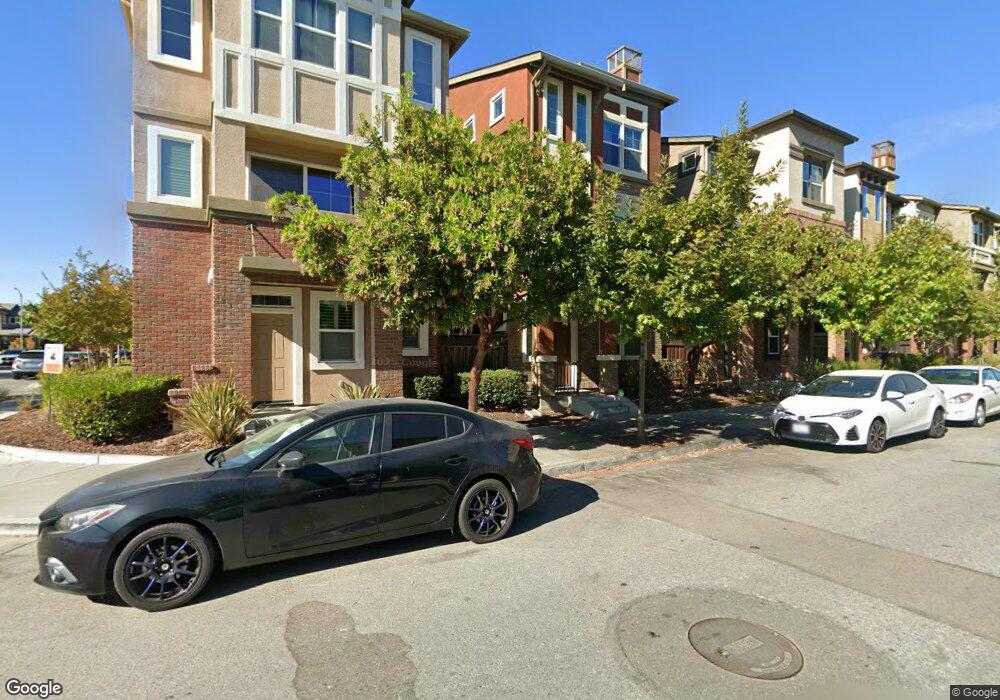
1515 Mercado Way San Jose, CA 95131
North Valley NeighborhoodEstimated Value: $1,479,013 - $1,636,000
3
Beds
3
Baths
1,693
Sq Ft
$911/Sq Ft
Est. Value
About This Home
This home is located at 1515 Mercado Way, San Jose, CA 95131 and is currently estimated at $1,542,253, approximately $910 per square foot. 1515 Mercado Way is a home with nearby schools including Vinci Park Elementary School, Morrill Middle School, and Independence High School.
Ownership History
Date
Name
Owned For
Owner Type
Purchase Details
Closed on
Nov 6, 2014
Sold by
Kb Home South Bay Inc
Bought by
Chan Jeremy and Chan Jenny Ching Yin
Current Estimated Value
Home Financials for this Owner
Home Financials are based on the most recent Mortgage that was taken out on this home.
Original Mortgage
$590,700
Outstanding Balance
$451,157
Interest Rate
3.92%
Mortgage Type
New Conventional
Estimated Equity
$1,091,096
Create a Home Valuation Report for This Property
The Home Valuation Report is an in-depth analysis detailing your home's value as well as a comparison with similar homes in the area
Home Values in the Area
Average Home Value in this Area
Purchase History
| Date | Buyer | Sale Price | Title Company |
|---|---|---|---|
| Chan Jeremy | $738,500 | First American Title Company |
Source: Public Records
Mortgage History
| Date | Status | Borrower | Loan Amount |
|---|---|---|---|
| Open | Chan Jeremy | $590,700 |
Source: Public Records
Tax History Compared to Growth
Tax History
| Year | Tax Paid | Tax Assessment Tax Assessment Total Assessment is a certain percentage of the fair market value that is determined by local assessors to be the total taxable value of land and additions on the property. | Land | Improvement |
|---|---|---|---|---|
| 2025 | $12,480 | $887,446 | $420,641 | $466,805 |
| 2024 | $12,480 | $870,046 | $412,394 | $457,652 |
| 2023 | $12,262 | $852,987 | $404,308 | $448,679 |
| 2022 | $12,215 | $836,263 | $396,381 | $439,882 |
| 2021 | $11,831 | $819,866 | $388,609 | $431,257 |
| 2020 | $11,474 | $811,460 | $384,625 | $426,835 |
| 2019 | $11,040 | $795,550 | $377,084 | $418,466 |
| 2018 | $10,888 | $779,952 | $369,691 | $410,261 |
| 2017 | $10,958 | $764,660 | $362,443 | $402,217 |
| 2016 | $10,526 | $749,668 | $355,337 | $394,331 |
| 2015 | $10,404 | $738,408 | $350,000 | $388,408 |
| 2014 | $1,832 | $125,000 | $125,000 | $0 |
Source: Public Records
Map
Nearby Homes
- 1038 Giacomo Ln
- 1368 Neleigh Place
- 1578 Thorncrest Dr
- 1291 Royal Crest Dr
- 1273 Briarberry Ct
- 1735 Parkview Green Cir
- 1325 Araujo St
- 1337 Araujo St
- 1612 Parkview Green Cir
- 1358 Oakland Rd Unit 81
- 1358 Old Oakland Unit 120
- 1327 Pebble Ct Unit 248
- 900 Golden Wheel Unit 67
- 900 Golden Wheel Park Dr Unit SPC 5
- 900 Golden Wheel Park Dr Unit 121
- 1399 Meadow Ridge Cir
- 1097 Ribisi Cir
- 678 Squire Ave
- 1889 Sable Place
- 1087 Yarrow Terrace
- 1527 Mercado Way
- 1503 Mercado Way
- 1539 Mercado Way
- 1511 Lee Place
- 1501 Lee Place
- 1529 Lee Place
- 1557 Mercado Way
- 1533 Lee Place
- 1512 Neleigh Place
- 1053 Eagle Way
- 1563 Mercado Way
- 1506 Neleigh Place
- 1038 Bellante Ln Unit 2
- 1038 Bellante Ln Unit 3
- 1038 Bellante Ln Unit 6
- 1038 Bellante Ln Unit 1
- 1038 Bellante Ln Unit 5
- 1038 Bellante Ln Unit 4
- 1059 Eagle Way
- 1530 Neleigh Place