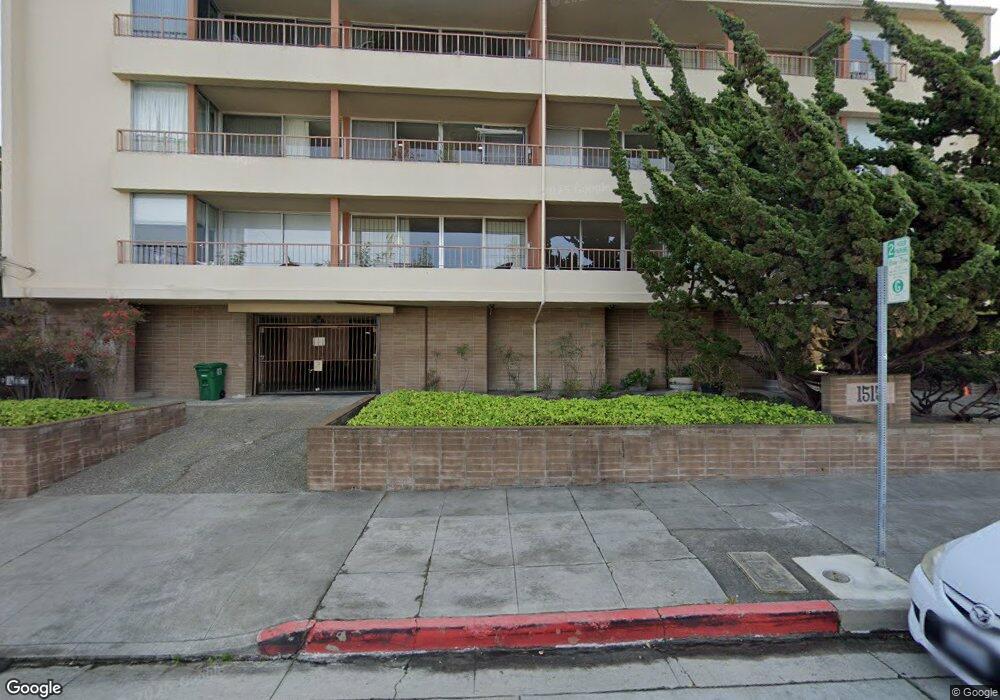
1515 Oxford St Unit 2C Berkeley, CA 94709
North Berkeley NeighborhoodEstimated Value: $1,168,000 - $1,434,000
2
Beds
1
Bath
2,060
Sq Ft
$640/Sq Ft
Est. Value
About This Home
This home is located at 1515 Oxford St Unit 2C, Berkeley, CA 94709 and is currently estimated at $1,318,623, approximately $640 per square foot. 1515 Oxford St Unit 2C is a home located in Alameda County with nearby schools including Berkeley Arts Magnet at Whittier School, Cragmont Elementary School, and Washington Elementary School.
Ownership History
Date
Name
Owned For
Owner Type
Purchase Details
Closed on
Apr 26, 2024
Sold by
Chen Gregory Shu and Chen-Lo Hu
Bought by
Chen-Hu Family Trust and Chen
Current Estimated Value
Purchase Details
Closed on
Sep 14, 2007
Sold by
Rosberg Elizabeth J
Bought by
Chen Chen Lo Hu Lo Hu
Purchase Details
Closed on
Mar 25, 1997
Sold by
Rosberg Elizabeth J
Bought by
Rosberg Elizabeth J
Purchase Details
Closed on
Mar 26, 1996
Sold by
Rowlands Kirk O and Hitch Nancy Squire
Bought by
Rosberg Carl G and Rosberg Elizabeth J
Create a Home Valuation Report for This Property
The Home Valuation Report is an in-depth analysis detailing your home's value as well as a comparison with similar homes in the area
Home Values in the Area
Average Home Value in this Area
Purchase History
| Date | Buyer | Sale Price | Title Company |
|---|---|---|---|
| Chen-Hu Family Trust | -- | None Listed On Document | |
| Chen Gregory Shu | -- | None Listed On Document | |
| Chen Chen-Lo Hu | -- | None Listed On Document | |
| Chen Chen Lo Hu Lo Hu | $765,000 | Accommodation | |
| Rosberg Elizabeth J | -- | -- | |
| Rosberg Carl G | $291,000 | Chicago Title Co |
Source: Public Records
Tax History Compared to Growth
Tax History
| Year | Tax Paid | Tax Assessment Tax Assessment Total Assessment is a certain percentage of the fair market value that is determined by local assessors to be the total taxable value of land and additions on the property. | Land | Improvement |
|---|---|---|---|---|
| 2025 | $15,672 | $997,773 | $301,432 | $703,341 |
| 2024 | $15,672 | $979,474 | $295,522 | $689,552 |
| 2023 | $15,411 | $965,765 | $289,729 | $676,036 |
| 2022 | $15,127 | $946,831 | $284,049 | $662,782 |
| 2021 | $15,161 | $928,273 | $278,482 | $649,791 |
| 2020 | $14,310 | $918,757 | $275,627 | $643,130 |
| 2019 | $13,711 | $900,748 | $270,224 | $630,524 |
| 2018 | $13,478 | $883,092 | $264,927 | $618,165 |
| 2017 | $13,024 | $865,780 | $259,734 | $606,046 |
| 2016 | $12,587 | $848,805 | $254,641 | $594,164 |
| 2015 | $12,417 | $836,060 | $250,818 | $585,242 |
| 2014 | $12,323 | $819,688 | $245,906 | $573,782 |
Source: Public Records
Map
Nearby Homes
- 1512 Walnut St
- 1444 Walnut St
- 1682 Oxford St
- 2201 Virginia St Unit 2
- 2201 Virginia St Unit 3
- 1444 Scenic Ave
- 2477 Virginia St
- 1610 Milvia St
- 2517 Cedar St
- 2451 Le Conte Ave
- 2117 Delaware St Unit B
- 1609 Bonita Ave Unit 3
- 1609 Bonita Ave Unit 5
- 1700 Le Roy Ave
- 1521 Josephine St
- 1300 Martin Luther King Junior Way
- 2634 Virginia St Unit 13
- 1850 Berryman St
- 1141 Oxford St
- 1906 Bonita Ave
- 1515 Oxford St Unit 2B
- 1515 Oxford St Unit 3C
- 1515 Oxford St Unit 2A
- 1515 Oxford St Unit 1C
- 1515 Oxford St Unit 1A
- 1515 Oxford St Unit 3A
- 1515 Oxford St
- 1515 Oxford St Unit 3B
- 1515 Oxford St Unit 1D
- 1515 Oxford St
- 1515 Oxford St
- 1515 Oxford St
- 1505 Oxford St
- 1519 Oxford St Unit K
- 1519 Oxford St Unit J
- 1519 Oxford St Unit F
- 1519 Oxford St Unit E
- 1519 Oxford St Unit D
- 1519 Oxford St Unit C
- 1519 Oxford St Unit B