1515 Schenone Ct Unit C Concord, CA 94521
Rose Glen NeighborhoodEstimated Value: $403,536 - $518,000
2
Beds
2
Baths
1,093
Sq Ft
$423/Sq Ft
Est. Value
About This Home
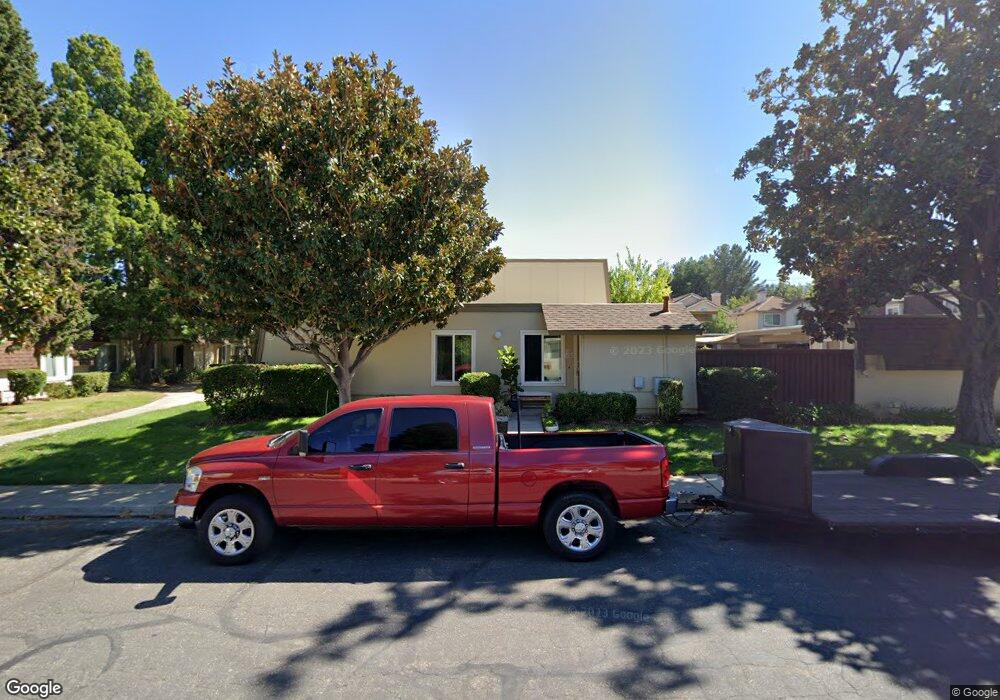
This home is located at 1515 Schenone Ct Unit C, Concord, CA 94521 and is currently estimated at $462,134, approximately $422 per square foot. 1515 Schenone Ct Unit C is a home located in Contra Costa County with nearby schools including Ayers Elementary School, Pine Hollow Middle School, and College Park High School.
Ownership History
Date
Name
Owned For
Owner Type
Purchase Details
Closed on
Jan 14, 2021
Sold by
Williams Douglas R and Williams Priscilla A
Bought by
Williams Douglas R and Williams Priscilla A
Current Estimated Value
Home Financials for this Owner
Home Financials are based on the most recent Mortgage that was taken out on this home.
Original Mortgage
$148,700
Interest Rate
2.7%
Mortgage Type
New Conventional
Purchase Details
Closed on
Nov 6, 2003
Sold by
Williams Douglas R and Williams Priscilla A
Bought by
Williams Douglas R and Williams Priscilla A
Purchase Details
Closed on
Jul 23, 1996
Sold by
Durant Nadine Donnelly and Donnelly Nadine M
Bought by
Durant Clarence and Durant Nadine D
Create a Home Valuation Report for This Property
The Home Valuation Report is an in-depth analysis detailing your home's value as well as a comparison with similar homes in the area
Home Values in the Area
Average Home Value in this Area
Purchase History
| Date | Buyer | Sale Price | Title Company |
|---|---|---|---|
| Williams Douglas R | -- | Amrock Llc | |
| Williams Douglas R | -- | Amrock Llc | |
| Williams Douglas R | -- | -- | |
| Durant Clarence | -- | -- |
Source: Public Records
Mortgage History
| Date | Status | Borrower | Loan Amount |
|---|---|---|---|
| Closed | Williams Douglas R | $148,700 |
Source: Public Records
Tax History
| Year | Tax Paid | Tax Assessment Tax Assessment Total Assessment is a certain percentage of the fair market value that is determined by local assessors to be the total taxable value of land and additions on the property. | Land | Improvement |
|---|---|---|---|---|
| 2025 | $1,559 | $57,786 | $15,901 | $41,885 |
| 2024 | $1,440 | $56,654 | $15,590 | $41,064 |
| 2023 | $1,440 | $55,544 | $15,285 | $40,259 |
| 2022 | $1,390 | $54,456 | $14,986 | $39,470 |
| 2021 | $1,333 | $53,390 | $14,693 | $38,697 |
| 2019 | $1,286 | $51,808 | $14,258 | $37,550 |
| 2018 | $1,221 | $50,793 | $13,979 | $36,814 |
| 2017 | $1,159 | $49,798 | $13,705 | $36,093 |
| 2016 | $1,091 | $48,823 | $13,437 | $35,386 |
| 2015 | $1,037 | $48,091 | $13,236 | $34,855 |
| 2014 | $981 | $47,150 | $12,977 | $34,173 |
Source: Public Records
Map
Nearby Homes
- 1520 Schenone Ct Unit 15
- 5333 Park Highlands Blvd Unit 27
- 1531 Garcez Dr
- 1505 Kirker Pass Rd Unit 122
- 1505 Kirker Pass Rd Unit 170
- 1505 Kirker Pass Rd Unit 164
- 1395 Kenwal Rd Unit A
- 5179 Paul Scarlet Dr
- 5451 Roundtree Place
- 1195 Kenwal Rd Unit B
- 5150 Brookside Ln
- 1120 Kenwal Rd Unit C
- 5434 Roundtree Ct Unit A
- 5492 Roundtree Dr Unit A
- 5468 Roundtree Dr Unit C
- 5460 Concord Blvd Unit E4
- 1560 Ayers Rd
- 5450 Concord Blvd Unit M3
- 5506 Nebraska Dr
- 5169 Concord Blvd
- 1515 Schenone Ct
- 1515 Schenone Ct Unit E
- 1515 Schenone Ct Unit D
- 1515 Schenone Ct Unit B
- 1515 Schenone Ct Unit A
- 1515A Schenone Ct
- 1515 Schenone B Ct
- 1511C Schenone Ct Unit C
- 1531 Schenone Ct Unit B
- 1531 Schenone Ct
- 1531 Schenone Ct Unit A
- 1531 Schenone Ct
- 1531 Schenone Ct Unit C
- 1531 Schenone Ct Unit D
- 1531 Schenone Ct Unit E
- 1531 Schenone Ct Unit F
- 1511 Schenone Ct Unit A
- 1511 Schenone Ct Unit C
- 1511 Schenone Ct Unit D
- 1511 Schenone Ct Unit E
Your Personal Tour Guide
Ask me questions while you tour the home.