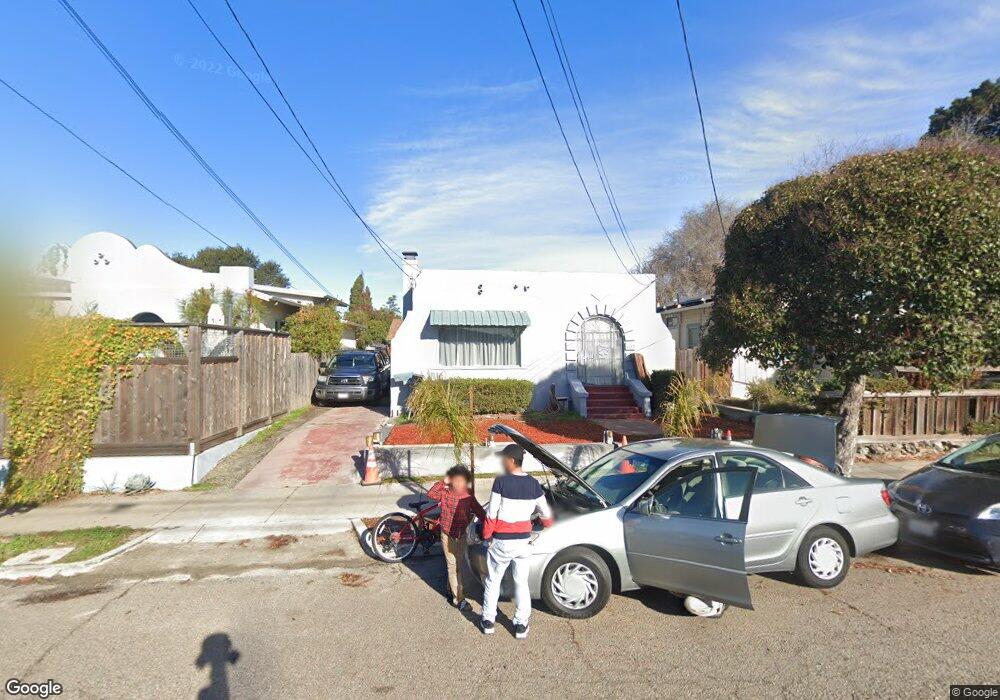
1515 Stuart St Berkeley, CA 94703
South Berkeley NeighborhoodEstimated Value: $572,827 - $1,411,000
4
Beds
2
Baths
1,953
Sq Ft
$446/Sq Ft
Est. Value
About This Home
This home is located at 1515 Stuart St, Berkeley, CA 94703 and is currently estimated at $870,609, approximately $445 per square foot. 1515 Stuart St is a home located in Alameda County with nearby schools including Malcolm X Elementary School, Washington Elementary School, and Oxford Elementary School.
Ownership History
Date
Name
Owned For
Owner Type
Purchase Details
Closed on
Jul 3, 2019
Sold by
Dorantes Adriana and Hernandez Miguel Angel
Bought by
Hernandez Miguel Angel and Dorantes Adriana
Current Estimated Value
Purchase Details
Closed on
Feb 12, 2019
Sold by
Moraga Josue Luis
Bought by
Hernandez Iris Danese
Purchase Details
Closed on
Jan 24, 2019
Sold by
Martin Eric C
Bought by
Hernandez Miguel Angel and Dorantes Adriana
Purchase Details
Closed on
Jan 19, 2018
Sold by
Martin Eric C and Mac C Martin Jr Living Trust
Bought by
Martin Eric C
Purchase Details
Closed on
Mar 1, 2017
Sold by
Martin Mac C
Bought by
Martin Mac C and The Mac C Martin Jr Living Tru
Create a Home Valuation Report for This Property
The Home Valuation Report is an in-depth analysis detailing your home's value as well as a comparison with similar homes in the area
Home Values in the Area
Average Home Value in this Area
Purchase History
| Date | Buyer | Sale Price | Title Company |
|---|---|---|---|
| Hernandez Miguel Angel | -- | None Available | |
| Hernandez Iris Danese | -- | Chicago Title Company | |
| Hernandez Miguel Angel | $493,000 | Chicago Title Company | |
| Martin Eric C | -- | None Available | |
| Martin Mac C | -- | None Available |
Source: Public Records
Tax History
| Year | Tax Paid | Tax Assessment Tax Assessment Total Assessment is a certain percentage of the fair market value that is determined by local assessors to be the total taxable value of land and additions on the property. | Land | Improvement |
|---|---|---|---|---|
| 2025 | $12,167 | $597,518 | $305,722 | $298,796 |
| 2024 | $12,167 | $585,666 | $299,728 | $292,938 |
| 2023 | $11,930 | $581,047 | $293,852 | $287,195 |
| 2022 | $12,130 | $569,655 | $288,091 | $281,564 |
| 2021 | $12,543 | $558,486 | $282,442 | $276,044 |
| 2020 | $11,466 | $552,763 | $279,548 | $273,215 |
| 2019 | $5,429 | $93,850 | $48,134 | $45,716 |
| 2018 | $5,250 | $92,010 | $47,190 | $44,820 |
| 2017 | $5,022 | $90,206 | $46,265 | $43,941 |
| 2016 | $4,707 | $88,438 | $45,358 | $43,080 |
| 2015 | $4,598 | $87,110 | $44,677 | $42,433 |
| 2014 | $4,607 | $85,402 | $43,801 | $41,601 |
Source: Public Records
Map
Nearby Homes
- 1530 Stuart St
- 2790 Sacramento St
- 2782 Sacramento St
- 2774 Sacramento St
- 2758 Sacramento St
- 2750 Sacramento St
- 1450 Ward St
- 1610 Oregon St
- 1515 Derby St
- 1535 Julia St
- 1612 Carleton St
- 2727 McGee Ave
- 1612 Parker St
- 1646 Ashby Ave
- 2926 Ellis St
- 1507 Prince St
- 1314 Ashby Ave
- 1741 Derby St
- 1634 Blake St
- 2701 Grant St
- 1513 Stuart St
- 1517 Stuart St
- 1519 Stuart St
- 1521 Stuart St
- 1518 Ward St
- 1520 Ward St
- 1514 Ward St Unit 1516
- 1514 Ward St
- 2733 Sacramento St
- 1525 Stuart St
- 1527 Stuart St Unit A
- 1510 Ward St
- 1510 Ward St
- 1522 Stuart St
- 1508 Ward St
- 1516 Stuart St
- 1529 Stuart St
- 1531 Stuart St
- 1520 Stuart St
- 1508 Stuart St
Your Personal Tour Guide
Ask me questions while you tour the home.