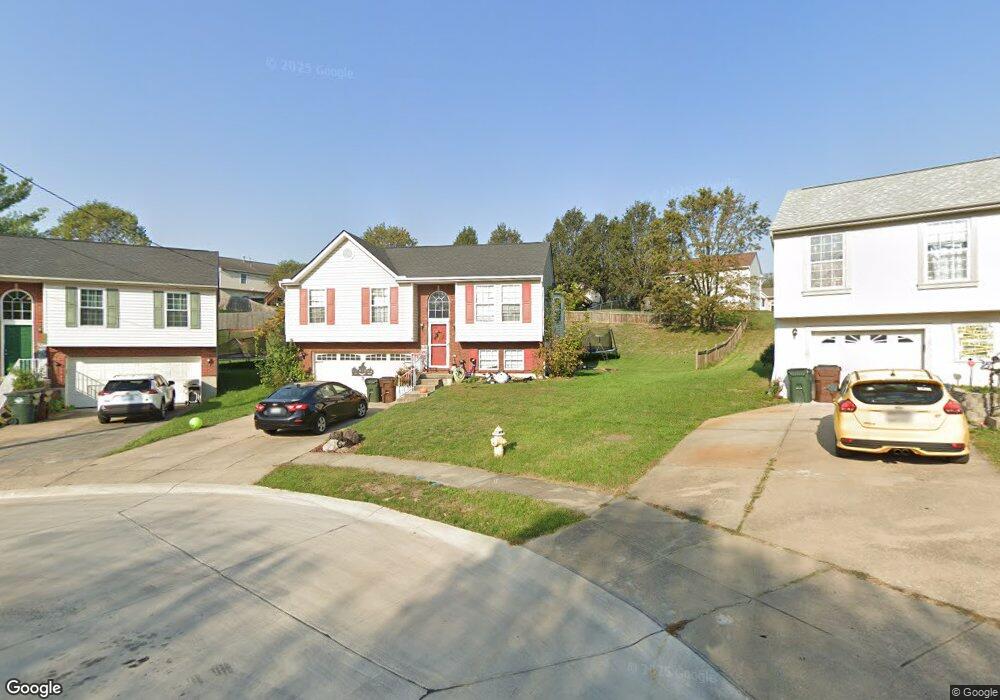
1515 Waterfall Way Elsmere, KY 41018
Estimated Value: $243,000 - $267,000
3
Beds
2
Baths
1,052
Sq Ft
$242/Sq Ft
Est. Value
About This Home
This home is located at 1515 Waterfall Way, Elsmere, KY 41018 and is currently estimated at $254,877, approximately $242 per square foot. 1515 Waterfall Way is a home located in Kenton County with nearby schools including Howell Elementary School, Tichenor Middle School, and Lloyd Memorial High School.
Ownership History
Date
Name
Owned For
Owner Type
Purchase Details
Closed on
Mar 24, 2017
Sold by
Vance Rachel L and Vance Michael L
Bought by
Billings Adam N
Current Estimated Value
Home Financials for this Owner
Home Financials are based on the most recent Mortgage that was taken out on this home.
Original Mortgage
$124,699
Outstanding Balance
$103,407
Interest Rate
4.17%
Mortgage Type
FHA
Estimated Equity
$151,470
Purchase Details
Closed on
Mar 7, 2011
Sold by
Boh Sharon Rhea
Bought by
Boh Jeffrey Michael
Purchase Details
Closed on
May 1, 1998
Sold by
H & L Builders Inc
Bought by
Boh Jeffrey M and Boh Sharon R
Home Financials for this Owner
Home Financials are based on the most recent Mortgage that was taken out on this home.
Original Mortgage
$102,780
Interest Rate
7.03%
Mortgage Type
FHA
Purchase Details
Closed on
Aug 1, 1996
Sold by
Bermec Co
Bought by
H & L Builder Inc
Create a Home Valuation Report for This Property
The Home Valuation Report is an in-depth analysis detailing your home's value as well as a comparison with similar homes in the area
Home Values in the Area
Average Home Value in this Area
Purchase History
| Date | Buyer | Sale Price | Title Company |
|---|---|---|---|
| Billings Adam N | $127,000 | 360 American Title Services | |
| Boh Jeffrey Michael | -- | None Available | |
| Boh Jeffrey M | $103,000 | -- | |
| H & L Builder Inc | $17,500 | -- |
Source: Public Records
Mortgage History
| Date | Status | Borrower | Loan Amount |
|---|---|---|---|
| Open | Billings Adam N | $124,699 | |
| Previous Owner | Boh Jeffrey M | $102,780 |
Source: Public Records
Tax History Compared to Growth
Tax History
| Year | Tax Paid | Tax Assessment Tax Assessment Total Assessment is a certain percentage of the fair market value that is determined by local assessors to be the total taxable value of land and additions on the property. | Land | Improvement |
|---|---|---|---|---|
| 2024 | $3,065 | $199,700 | $30,000 | $169,700 |
| 2023 | $2,994 | $199,700 | $30,000 | $169,700 |
| 2022 | $2,124 | $127,000 | $25,000 | $102,000 |
| 2021 | $2,150 | $127,000 | $25,000 | $102,000 |
| 2020 | $2,138 | $127,000 | $25,000 | $102,000 |
| 2019 | $2,109 | $127,000 | $25,000 | $102,000 |
| 2018 | $2,152 | $127,000 | $20,000 | $107,000 |
| 2017 | $1,876 | $117,500 | $20,000 | $97,500 |
| 2015 | $2,214 | $117,500 | $20,000 | $97,500 |
| 2014 | $2,166 | $117,500 | $20,000 | $97,500 |
Source: Public Records
Map
Nearby Homes
- 1149 Fallbrook Dr
- 10 Theta Ct
- 3604 Concord Dr
- 3288 Kingsburg Ct
- 3295 Kingsburg Ct
- 3310 Kingsburg Ct
- 35 Lexington Dr
- 1445 Garvey Ave
- 3545 Jacqueline Dr
- 804 Walnut Way
- 1007 Stevenson Rd
- 922 Central Row Rd
- 3850 Turkeyfoot Rd
- 217 Buckner St
- 3402 Southway Ridge
- 630 Perimeter Dr
- 13 Ironstone Cir
- 12 Creekside Cir
- 3409 Misty Creek Dr
- 3737 Autumn Rd
- 1515 Waterwall
- 1519 Waterfall Way
- 1511 Waterfall Way
- 1119 Pebble Creek Dr
- 1115 Pebble Creek Dr
- 1109 Pebble Creek Dr
- 1507 Waterfall Way
- 1514 Clovernook Dr
- 1123 Pebble Creek Dr
- 1522 Waterfall Way
- 1506 Clovernook Dr
- 1518 Clovernook Dr
- 1503 Waterfall Way
- 1502 Clovernook Dr
- 1522 Clovernook Dr
- 1518 Waterfall Way
- 1514 Waterfall Way
- 1499 Waterfall Way
- 1526 Clovernook Dr
- 1510 Waterfall Way