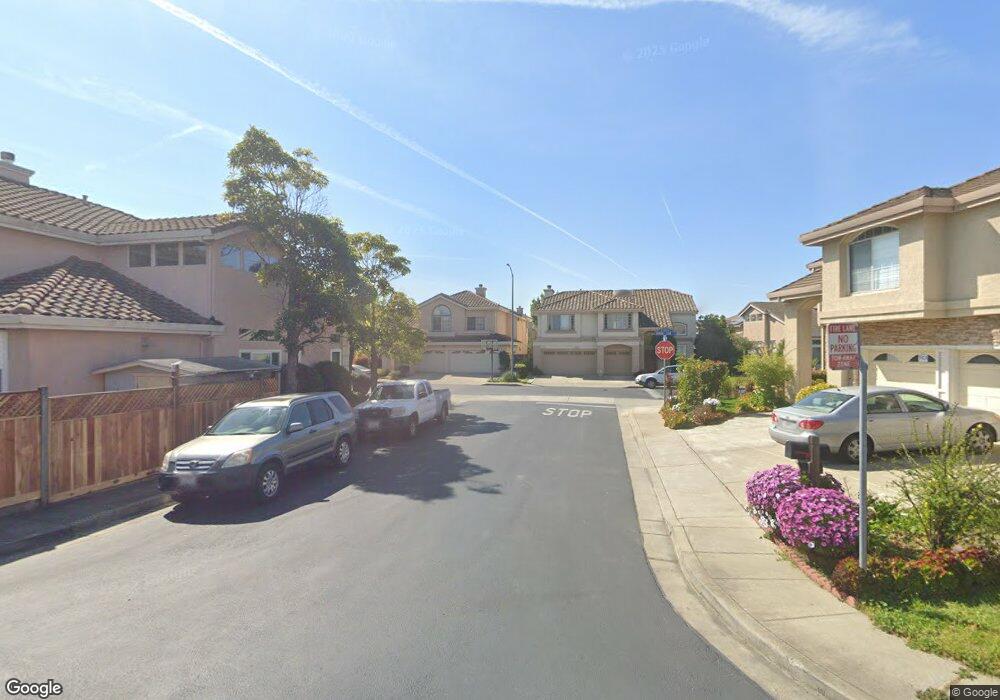
15152 Flying Mist Rd San Leandro, CA 94579
Heron Bay NeighborhoodEstimated Value: $1,220,000 - $1,322,000
4
Beds
4
Baths
2,419
Sq Ft
$524/Sq Ft
Est. Value
About This Home
This home is located at 15152 Flying Mist Rd, San Leandro, CA 94579 and is currently estimated at $1,266,506, approximately $523 per square foot. 15152 Flying Mist Rd is a home located in Alameda County with nearby schools including Dayton Elementary School, Washington Manor Middle School, and Arroyo High School.
Ownership History
Date
Name
Owned For
Owner Type
Purchase Details
Closed on
Jan 25, 2007
Sold by
Chan Don Ming and Mach Judy
Bought by
Chan Don Ming and Mach Judy
Current Estimated Value
Purchase Details
Closed on
Nov 10, 2004
Sold by
Chan Don Ming and Mach Judy
Bought by
Chan Don Ming and Mach Judy
Purchase Details
Closed on
Jun 26, 2003
Sold by
Nhu Minh Tinh and Tran Minh Sam
Bought by
Chan Don Ming and Mach Judy
Home Financials for this Owner
Home Financials are based on the most recent Mortgage that was taken out on this home.
Original Mortgage
$150,000
Outstanding Balance
$63,388
Interest Rate
5.18%
Mortgage Type
Credit Line Revolving
Estimated Equity
$1,203,118
Purchase Details
Closed on
Jun 25, 1999
Sold by
Judy Chan Don M and Judy Mach
Bought by
Nhu Minh Tinh and Tran Minh Sam
Purchase Details
Closed on
Aug 25, 1997
Sold by
Dover Investment Corp
Bought by
Chan Don Ming and Mach Judy
Home Financials for this Owner
Home Financials are based on the most recent Mortgage that was taken out on this home.
Original Mortgage
$100,000
Interest Rate
7.43%
Create a Home Valuation Report for This Property
The Home Valuation Report is an in-depth analysis detailing your home's value as well as a comparison with similar homes in the area
Home Values in the Area
Average Home Value in this Area
Purchase History
| Date | Buyer | Sale Price | Title Company |
|---|---|---|---|
| Chan Don Ming | -- | None Available | |
| Chan Don Ming | -- | -- | |
| Chan Don Ming | -- | Alliance Title Company | |
| Nhu Minh Tinh | -- | -- | |
| Chan Don Ming | $307,500 | First American Title Guarant |
Source: Public Records
Mortgage History
| Date | Status | Borrower | Loan Amount |
|---|---|---|---|
| Open | Chan Don Ming | $150,000 | |
| Closed | Chan Don Ming | $100,000 |
Source: Public Records
Tax History
| Year | Tax Paid | Tax Assessment Tax Assessment Total Assessment is a certain percentage of the fair market value that is determined by local assessors to be the total taxable value of land and additions on the property. | Land | Improvement |
|---|---|---|---|---|
| 2025 | $6,260 | $483,816 | $147,532 | $343,284 |
| 2024 | $6,260 | $474,194 | $144,640 | $336,554 |
| 2023 | $6,233 | $471,760 | $141,804 | $329,956 |
| 2022 | $6,139 | $455,510 | $139,024 | $323,486 |
| 2021 | $5,967 | $446,442 | $136,298 | $317,144 |
| 2020 | $5,835 | $448,794 | $134,901 | $313,893 |
| 2019 | $5,842 | $439,996 | $132,256 | $307,740 |
| 2018 | $5,508 | $431,370 | $129,663 | $301,707 |
| 2017 | $5,252 | $422,914 | $127,122 | $295,792 |
| 2016 | $5,127 | $414,624 | $124,630 | $289,994 |
| 2015 | $5,015 | $408,396 | $122,758 | $285,638 |
| 2014 | $4,939 | $400,396 | $120,353 | $280,043 |
Source: Public Records
Map
Nearby Homes
- 15100 Shining Star Ln
- 1728 Hubbard Ave
- 120 Santa Teresa
- 232 Santa Susana Unit 232
- 15355 Bittern Ct
- 157 Santa Teresa
- 1367 Hubbard Ave
- 14615 Doolittle Dr
- 1428 Abbey Ave
- 356 Santa Paula
- 14544 Tiburon Rd
- 2312 Belvedere Ave
- 2322 Belvedere Ave
- 1343 Fargo Ave
- 2364 Driftwood Way
- 14179 Doolittle Dr
- 14322 Trinidad Rd
- 15518 Harbor Way
- 2515 Galleon Place Unit 129
- 14404 Seagate Dr
- 15150 Flying Mist Rd
- 2019 Gulfstream Way
- 2017 Gulfstream Way
- 15153 Shining Star Ln
- 15151 Shining Star Ln
- 2020 Yankee Ct
- 15138 Flying Mist Rd
- 2015 Gulfstream Way
- 2021 Gulfstream Way
- 15139 Shining Star Ln
- 2022 Yankee Ct
- 2023 Gulfstream Way
- 15136 Flying Mist Rd
- 15137 Shining Star Ln
- 2012 Gulfstream Way
- 2016 Gulfstream Way
- 15137 Flying Mist Rd
- 2018 Gulfstream Way
- 2010 Gulfstream Way
- 15150 Shining Star Ln
Your Personal Tour Guide
Ask me questions while you tour the home.