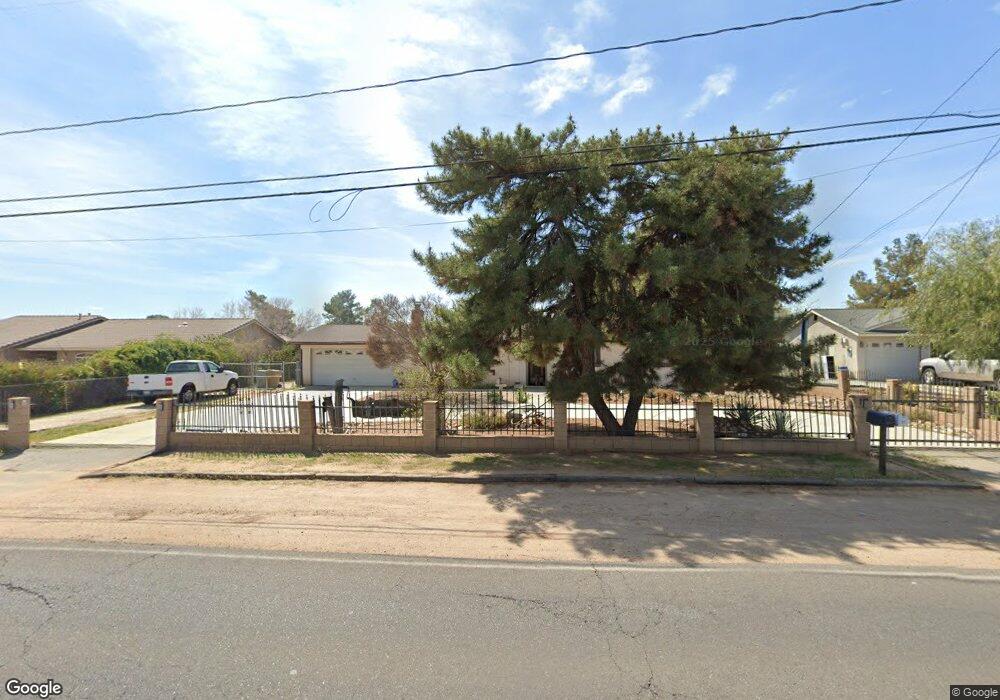
15153 Mesquite St Hesperia, CA 92345
Estimated Value: $432,000 - $532,000
3
Beds
3
Baths
1,451
Sq Ft
$320/Sq Ft
Est. Value
About This Home
This home is located at 15153 Mesquite St, Hesperia, CA 92345 and is currently estimated at $464,473, approximately $320 per square foot. 15153 Mesquite St is a home located in San Bernardino County with nearby schools including Cottonwood Elementary School, Cedar Middle School, and Oak Hills High School.
Ownership History
Date
Name
Owned For
Owner Type
Purchase Details
Closed on
Feb 7, 2020
Sold by
Hearrell Richard Allan and Smith Kim Marie
Bought by
Santoyo Alfonso
Current Estimated Value
Home Financials for this Owner
Home Financials are based on the most recent Mortgage that was taken out on this home.
Original Mortgage
$275,488
Outstanding Balance
$240,409
Interest Rate
2.87%
Mortgage Type
FHA
Estimated Equity
$224,064
Purchase Details
Closed on
Jul 13, 2016
Sold by
Hearrell Hearrell Ralph L Ralph L
Bought by
Hearrell Ralph Leroy and Hearrell Richard Allan
Home Financials for this Owner
Home Financials are based on the most recent Mortgage that was taken out on this home.
Original Mortgage
$279,000
Interest Rate
3.87%
Mortgage Type
Reverse Mortgage Home Equity Conversion Mortgage
Purchase Details
Closed on
Apr 2, 1994
Sold by
Hearrell Ralph L
Bought by
Hearrell Ralph L and Hearrell Jolan B
Create a Home Valuation Report for This Property
The Home Valuation Report is an in-depth analysis detailing your home's value as well as a comparison with similar homes in the area
Home Values in the Area
Average Home Value in this Area
Purchase History
| Date | Buyer | Sale Price | Title Company |
|---|---|---|---|
| Santoyo Alfonso | $287,000 | Chicago Title | |
| Hearrell Ralph Leroy | -- | Nextitle | |
| Hearrell Ralph L | -- | -- |
Source: Public Records
Mortgage History
| Date | Status | Borrower | Loan Amount |
|---|---|---|---|
| Open | Santoyo Alfonso | $275,488 | |
| Previous Owner | Hearrell Ralph Leroy | $279,000 |
Source: Public Records
Tax History Compared to Growth
Tax History
| Year | Tax Paid | Tax Assessment Tax Assessment Total Assessment is a certain percentage of the fair market value that is determined by local assessors to be the total taxable value of land and additions on the property. | Land | Improvement |
|---|---|---|---|---|
| 2025 | $3,428 | $313,878 | $62,776 | $251,102 |
| 2024 | $3,428 | $307,723 | $61,545 | $246,178 |
| 2023 | $3,390 | $301,689 | $60,338 | $241,351 |
| 2022 | $3,312 | $295,774 | $59,155 | $236,619 |
| 2021 | $3,252 | $289,974 | $57,995 | $231,979 |
| 2020 | $1,233 | $108,425 | $3,425 | $105,000 |
| 2019 | $1,137 | $106,299 | $3,358 | $102,941 |
| 2018 | $1,115 | $104,215 | $3,292 | $100,923 |
| 2017 | $1,095 | $102,171 | $3,227 | $98,944 |
| 2016 | $1,071 | $100,168 | $3,164 | $97,004 |
| 2015 | $1,057 | $98,663 | $3,116 | $95,547 |
| 2014 | $1,042 | $96,730 | $3,055 | $93,675 |
Source: Public Records
Map
Nearby Homes
- 0 Situs Address Unit PW25230513
- 0 Parcel# 0405-042-21-0-000 Unit HD25110608
- 0 Bear Valley Unit HD25248981
- 0 C Ave & Mauna Loa St Unit HD25149622
- Fleming Plan at Laurel at Silverwood
- 111 Starlight Dr
- 8853 Waltham Ave
- Agate Plan at Laurel at Silverwood
- 8864 Waltham Ave
- 395 State Hwy
- 8801 3rd Ave
- 8802 Waltham Ave
- 0 01n-11e-17 Unit CV25040184
- 17410 Whiskey Mountain
- 0 Tbv Unit HD25069247
- 0 3RD SW 3rd St SW
- 123 Main
- 0 Unit HD25170598
- 0 G Ln Unit AR25245177
- 17426 Whiskey Mountain
- 15137 Mesquite St
- 15169 Mesquite St
- 15123 Mesquite St
- 15146 Mesquite St
- 15166 Mesquite St
- 15107 Mesquite St
- 15156 Mesquite St
- 15203 Mesquite St
- 15116 Mesquite St
- 15152 Ash St
- 15093 Mesquite St
- 15190 Mesquite St
- 15219 Mesquite St
- 15168 Ash St
- 15124 Ash St
- 15077 Mesquite St
- 15182 Ash St
- 15108 Ash St
- 15233 Mesquite St
- 15202 Ash St