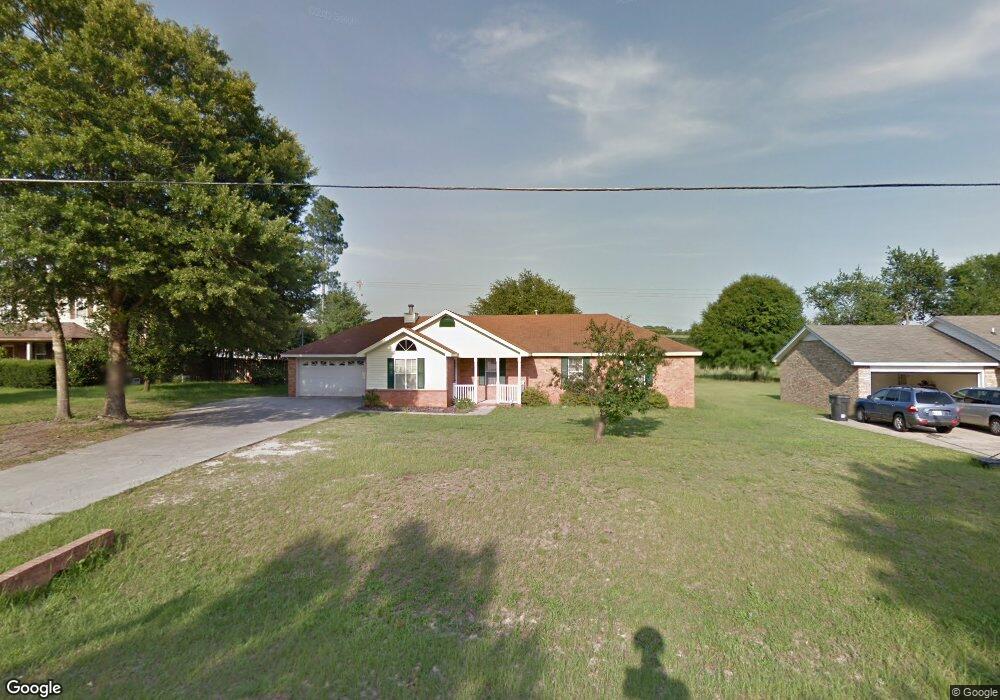
1515E Pine Ridge Dr E Hephzibah, GA 30815
McBean NeighborhoodEstimated Value: $248,000 - $283,000
4
Beds
2
Baths
1,813
Sq Ft
$144/Sq Ft
Est. Value
About This Home
This home is located at 1515E Pine Ridge Dr E, Hephzibah, GA 30815 and is currently estimated at $260,543, approximately $143 per square foot. 1515E Pine Ridge Dr E is a home located in Richmond County with nearby schools including McBean Elementary School, Pine Hill Middle School, and Johnson Magnet.
Ownership History
Date
Name
Owned For
Owner Type
Purchase Details
Closed on
Feb 1, 1996
Sold by
Mccumbers Builders Inc Mc Cumbers Build
Bought by
Jihad Rashad Sharif
Current Estimated Value
Purchase Details
Closed on
Jan 31, 1996
Sold by
Mccumbers Builders
Bought by
Jihad Rashad Sharif
Purchase Details
Closed on
Aug 4, 1995
Sold by
Mccumbers Kenneth
Bought by
Mccumbers Builders
Purchase Details
Closed on
Mar 23, 1995
Sold by
Mccumbers Kenneth Mc Cumbers Kenneth
Bought by
Mccumbers Builders Inc Mc Cumbers Build
Purchase Details
Closed on
Dec 8, 1993
Sold by
Mccumbers Kenneth Mc Cumbers Kenneth
Bought by
Mccumbers Builders Inc Mc Cumbers Build
Purchase Details
Closed on
Dec 7, 1993
Sold by
Mccumbers Kenneth
Bought by
Mccumbers Builders
Purchase Details
Closed on
Sep 21, 1993
Sold by
Mccumbers Kenneth
Bought by
Mccumbers Kenneth
Purchase Details
Closed on
Nov 24, 1992
Sold by
Cedar Ridge Farms Inc Village Square L
Bought by
Mccumbers Kenneth
Create a Home Valuation Report for This Property
The Home Valuation Report is an in-depth analysis detailing your home's value as well as a comparison with similar homes in the area
Home Values in the Area
Average Home Value in this Area
Purchase History
| Date | Buyer | Sale Price | Title Company |
|---|---|---|---|
| Jihad Rashad Sharif | -- | -- | |
| Jihad Rashad Sharif | $93,000 | -- | |
| Mccumbers Builders | -- | -- | |
| Mccumbers Builders Inc Mc Cumbers Build | -- | -- | |
| Mccumbers Builders Inc Mc Cumbers Build | -- | -- | |
| Mccumbers Builders | $228,000 | -- | |
| Mccumbers Kenneth | -- | -- | |
| Mccumbers Kenneth | -- | -- |
Source: Public Records
Tax History
| Year | Tax Paid | Tax Assessment Tax Assessment Total Assessment is a certain percentage of the fair market value that is determined by local assessors to be the total taxable value of land and additions on the property. | Land | Improvement |
|---|---|---|---|---|
| 2025 | $3,046 | $95,880 | $8,800 | $87,080 |
| 2024 | $3,046 | $93,988 | $8,800 | $85,188 |
| 2023 | $2,916 | $78,824 | $8,800 | $70,024 |
| 2022 | $2,383 | $70,950 | $8,800 | $62,150 |
| 2021 | $1,946 | $50,456 | $8,800 | $41,656 |
| 2020 | $1,917 | $50,456 | $8,800 | $41,656 |
| 2019 | $2,028 | $50,456 | $8,800 | $41,656 |
| 2018 | $2,042 | $50,456 | $8,800 | $41,656 |
| 2017 | $2,007 | $50,456 | $8,800 | $41,656 |
| 2016 | $1,846 | $50,456 | $8,800 | $41,656 |
| 2015 | $2,064 | $50,423 | $8,800 | $41,623 |
| 2014 | $2,023 | $50,423 | $8,800 | $41,623 |
Source: Public Records
Map
Nearby Homes
- 4362 Big Dipper Cir
- 4226 Forest Rd
- 4331 Big Dipper Cir
- 4202 Cedarwood Dr
- 1679 Pine Ridge Dr N
- 1663 Pine Ridge Dr N
- 1727 Pine Ridge Dr N
- 1660 Pine Ridge Dr N
- 1716 Pine Ridge Dr N
- 1687 Pine Ridge Dr N
- 1671 Pine Ridge Dr N
- 1707 Pine Ridge Dr N
- 1683 Pine Ridge Dr N
- 4064 Fairlane Ct
- 4130 Old Waynesboro Rd
- 1573 Oglethorpe Dr
- 2114 Southlake Pkwy
- 2121 Southlake Pkwy
- 1233 Paramount Ct
- 4051 Goshen Lake Dr S
- 1515 Pine Ridge Dr E
- 1513 Pine Ridge Dr E
- 1517 Pine Ridge Dr E
- 1511E Pine Ridge Dr E
- 1519 Pine Ridge Dr E
- 1521E Pine Ridge Dr E
- 1508E Pine Ridge Dr E
- 1506 Pine Ridge Dr E
- 1506E Pine Ridge Dr E
- 1509E Pine Ridge Dr E
- 1510E Pine Ridge Dr E
- 1512 Pine Ridge Dr E
- 1523E Pine Ridge Dr E
- 1525E Pine Ridge Dr E
- 1504E Pine Ridge Dr E
- 1512E Pine Ridge Dr E
- 1514 Pine Ridge Dr E
- 1507E Pine Ridge Dr E
- 1505 Pine Ridge Dr E
- 1505 Pine Ridge Dr E
Your Personal Tour Guide
Ask me questions while you tour the home.