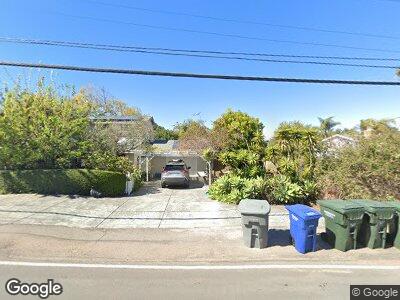
1516 Caudor St Encinitas, CA 92024
Leucadia NeighborhoodEstimated Value: $1,737,927 - $2,389,000
3
Beds
2
Baths
1,798
Sq Ft
$1,175/Sq Ft
Est. Value
About This Home
This home is located at 1516 Caudor St, Encinitas, CA 92024 and is currently estimated at $2,112,732, approximately $1,175 per square foot. 1516 Caudor St is a home located in San Diego County with nearby schools including Capri Elementary School, Diegueno Middle School, and La Costa Canyon High School.
Ownership History
Date
Name
Owned For
Owner Type
Purchase Details
Closed on
Jun 1, 2012
Sold by
Venard Terry L and Venard Rhoda
Bought by
Venard Terry L and Venard Rhoda
Current Estimated Value
Home Financials for this Owner
Home Financials are based on the most recent Mortgage that was taken out on this home.
Original Mortgage
$190,000
Interest Rate
3.84%
Mortgage Type
New Conventional
Purchase Details
Closed on
Oct 30, 2008
Sold by
Venard Terry L and Venard Rhoda
Bought by
Venard Terry L and Venard Rhoda
Purchase Details
Closed on
Sep 13, 2006
Sold by
Venard Terry L and Venard Rhoda
Bought by
Venard Terry L and Venard Rhoda
Home Financials for this Owner
Home Financials are based on the most recent Mortgage that was taken out on this home.
Original Mortgage
$200,000
Interest Rate
6.43%
Mortgage Type
Stand Alone Refi Refinance Of Original Loan
Create a Home Valuation Report for This Property
The Home Valuation Report is an in-depth analysis detailing your home's value as well as a comparison with similar homes in the area
Home Values in the Area
Average Home Value in this Area
Purchase History
| Date | Buyer | Sale Price | Title Company |
|---|---|---|---|
| Venard Terry L | -- | Accommodation | |
| Venard Terry L | -- | Fidelity National Title | |
| Venard Terry L | -- | None Available | |
| Venard Terry L | -- | First American Title Co |
Source: Public Records
Mortgage History
| Date | Status | Borrower | Loan Amount |
|---|---|---|---|
| Closed | Venard Terry L | $190,000 | |
| Closed | Venard Terry L | $200,000 | |
| Closed | Venard Terry L | $95,000 |
Source: Public Records
Tax History Compared to Growth
Tax History
| Year | Tax Paid | Tax Assessment Tax Assessment Total Assessment is a certain percentage of the fair market value that is determined by local assessors to be the total taxable value of land and additions on the property. | Land | Improvement |
|---|---|---|---|---|
| 2024 | $2,032 | $142,794 | $37,339 | $105,455 |
| 2023 | $1,935 | $139,995 | $36,607 | $103,388 |
| 2022 | $1,862 | $137,251 | $35,890 | $101,361 |
| 2021 | $1,804 | $134,561 | $35,187 | $99,374 |
| 2020 | $1,751 | $133,183 | $34,827 | $98,356 |
| 2019 | $1,721 | $130,573 | $34,145 | $96,428 |
| 2018 | $1,692 | $128,014 | $33,476 | $94,538 |
| 2017 | $1,666 | $125,505 | $32,820 | $92,685 |
| 2016 | $1,621 | $123,045 | $32,177 | $90,868 |
| 2015 | $1,571 | $121,198 | $31,694 | $89,504 |
| 2014 | $1,518 | $118,825 | $31,074 | $87,751 |
Source: Public Records
Map
Nearby Homes
- 1551 Burgundy Rd
- 1502 Christine Place Unit 1
- 1460 Orpheus Ave
- 475 Parkwood Ln
- 1326-28 Rainbow Ridge Ln
- 1372 Hymettus Ave
- 1763 Sky Loft Ln
- 1592 Hawk View Dr
- 1808 Amalfi Dr
- 715 Blossom Rd
- 305 Sanford St
- 1229 Swallowtail Ct
- 1159 Hymettus Ave
- 1647 Hawk View Dr
- 1540 Surf Rd
- 278 Sanford St
- 1786 Swallowtail Rd
- 363 Andrew Ave
- 1059 Hymettus Ave
- 1549 N Vulcan Ave Unit 8