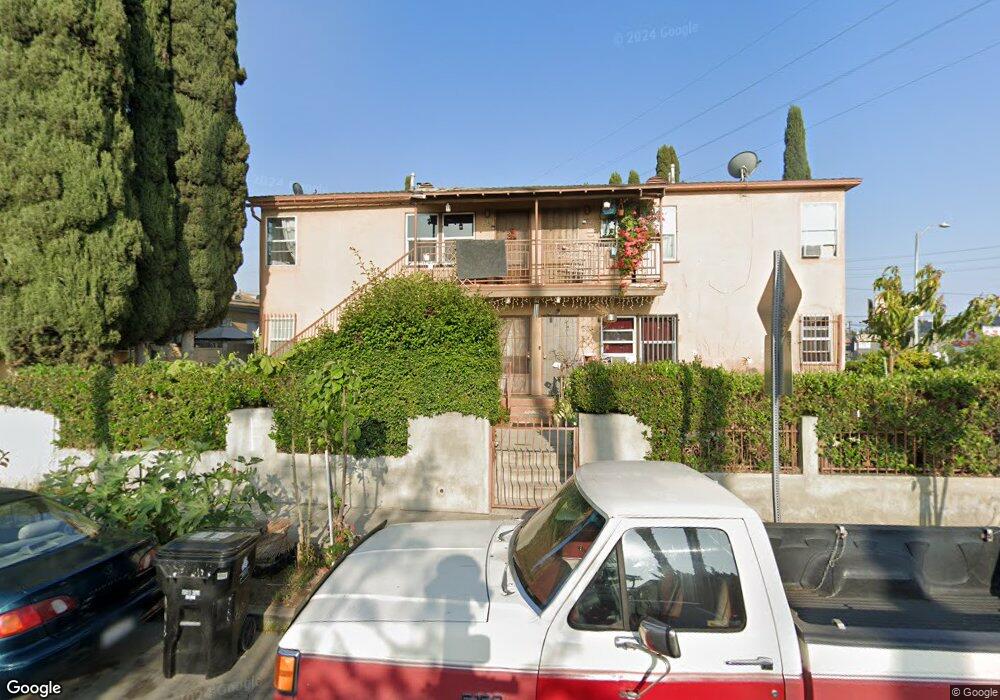
1516 S Mansfield Ave Los Angeles, CA 90019
Mid-City NeighborhoodEstimated Value: $881,434 - $1,469,000
4
Beds
4
Baths
2,500
Sq Ft
$478/Sq Ft
Est. Value
About This Home
This home is located at 1516 S Mansfield Ave, Los Angeles, CA 90019 and is currently estimated at $1,193,859, approximately $477 per square foot. 1516 S Mansfield Ave is a home located in Los Angeles County with nearby schools including Saturn Street Elementary School, Los Angeles Senior High School, and Stella Middle Charter Academy.
Ownership History
Date
Name
Owned For
Owner Type
Purchase Details
Closed on
Jun 1, 2018
Sold by
Saghian Yoram
Bought by
The Pico Place Llc
Current Estimated Value
Purchase Details
Closed on
Sep 16, 2011
Sold by
Venice Plaza Llc
Bought by
Saghian Yoram and Saghian Daniel
Purchase Details
Closed on
Aug 19, 2010
Sold by
Cho Seung Hui
Bought by
Venice Plaza Llc
Purchase Details
Closed on
Jan 29, 2002
Sold by
Cho Ryong Ell
Bought by
Cho Seung Hui
Home Financials for this Owner
Home Financials are based on the most recent Mortgage that was taken out on this home.
Original Mortgage
$222,500
Interest Rate
7.13%
Purchase Details
Closed on
Feb 8, 2001
Sold by
Um Sala
Bought by
Um Wae Sook
Purchase Details
Closed on
Sep 19, 2000
Sold by
Um Wae S
Bought by
Um Sala
Create a Home Valuation Report for This Property
The Home Valuation Report is an in-depth analysis detailing your home's value as well as a comparison with similar homes in the area
Home Values in the Area
Average Home Value in this Area
Purchase History
| Date | Buyer | Sale Price | Title Company |
|---|---|---|---|
| The Pico Place Llc | -- | None Available | |
| Saghian Yousef | -- | None Available | |
| Saghian Daniel | -- | None Available | |
| Saghian Yorm | -- | None Available | |
| Saghian Yoram | -- | None Available | |
| Venice Plaza Llc | $270,000 | None Available | |
| Cho Seung Hui | -- | First American Title Co | |
| Cho Seung Hui | $247,500 | First American Title Co | |
| Um Wae Sook | -- | -- | |
| Um Sala | -- | -- |
Source: Public Records
Mortgage History
| Date | Status | Borrower | Loan Amount |
|---|---|---|---|
| Previous Owner | Cho Seung Hui | $222,500 |
Source: Public Records
Tax History Compared to Growth
Tax History
| Year | Tax Paid | Tax Assessment Tax Assessment Total Assessment is a certain percentage of the fair market value that is determined by local assessors to be the total taxable value of land and additions on the property. | Land | Improvement |
|---|---|---|---|---|
| 2025 | $7,290 | $576,516 | $384,346 | $192,170 |
| 2024 | $7,290 | $565,212 | $376,810 | $188,402 |
| 2023 | $7,159 | $554,130 | $369,422 | $184,708 |
| 2022 | $6,842 | $543,266 | $362,179 | $181,087 |
| 2021 | $6,748 | $532,615 | $355,078 | $177,537 |
| 2020 | $6,812 | $527,155 | $351,438 | $175,717 |
| 2019 | $6,555 | $516,820 | $344,548 | $172,272 |
| 2018 | $6,465 | $506,688 | $337,793 | $168,895 |
| 2016 | $6,172 | $487,015 | $324,677 | $162,338 |
| 2015 | $6,086 | $479,701 | $319,801 | $159,900 |
| 2014 | $6,132 | $470,305 | $313,537 | $156,768 |
Source: Public Records
Map
Nearby Homes
- 1373 S Orange Dr
- 1638 S Longwood Ave
- 1502 S Redondo Blvd
- 4842 W 17th St
- 1733 S Longwood Ave
- 1623 S Sycamore Ave
- 4817 Saint Charles Place
- 1801 S Longwood Ave
- 5036 Pickford St
- 1296 S Citrus Ave
- 1273 S Sycamore Ave
- 1656 S Rimpau Blvd
- 1680 S Rimpau Blvd
- 4835 Pickford St
- 1327 Meadowbrook Ave
- 1801 S Sycamore Ave
- 1626 S Rimpau Blvd
- 1284 S Orange Dr
- 5212 Packard St
- 4725 St Elmo Dr
- 1510 S Mansfield Ave
- 1504 S Mansfield Ave
- 1502 S Mansfield Ave
- 1515 S Mansfield Ave
- 1511 S Mansfield Ave
- 1434 S Mansfield Ave
- 1507 S Mansfield Ave
- 5005 Venice Blvd Unit 4
- 5005 Venice Blvd
- 1503 S Mansfield Ave
- 5009 Venice Blvd
- 1430 S Mansfield Ave
- 1435 S Mansfield Ave
- 1424 S Mansfield Ave
- 1502 S Orange Dr
- 1440 S Orange Dr
- 1506 S Orange Dr
- 1510 S Orange Dr
- 1427 S Mansfield Ave
- 1430 S Orange Dr Unit A