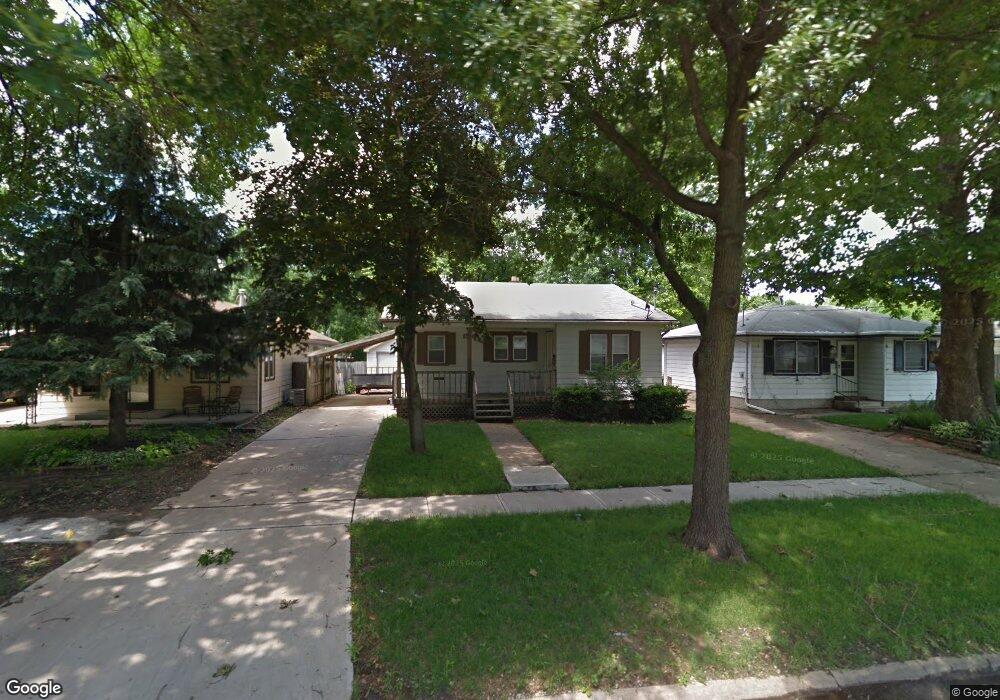
1516 Searle St Des Moines, IA 50317
Fairmont Park NeighborhoodEstimated Value: $157,000 - $173,000
2
Beds
2
Baths
846
Sq Ft
$196/Sq Ft
Est. Value
About This Home
This home is located at 1516 Searle St, Des Moines, IA 50317 and is currently estimated at $166,015, approximately $196 per square foot. 1516 Searle St is a home located in Polk County with nearby schools including Phillips Elementary, Joshua Christian Academy-Main Campus, and St Joseph Elementary School.
Ownership History
Date
Name
Owned For
Owner Type
Purchase Details
Closed on
Oct 21, 2002
Sold by
Scrignoli Tanya J and Scrignoli James W
Bought by
Scrignoli Patrick N
Current Estimated Value
Home Financials for this Owner
Home Financials are based on the most recent Mortgage that was taken out on this home.
Original Mortgage
$80,000
Interest Rate
5.67%
Mortgage Type
Balloon
Create a Home Valuation Report for This Property
The Home Valuation Report is an in-depth analysis detailing your home's value as well as a comparison with similar homes in the area
Home Values in the Area
Average Home Value in this Area
Purchase History
| Date | Buyer | Sale Price | Title Company |
|---|---|---|---|
| Scrignoli Patrick N | $79,500 | -- |
Source: Public Records
Mortgage History
| Date | Status | Borrower | Loan Amount |
|---|---|---|---|
| Closed | Scrignoli Patrick N | $80,000 |
Source: Public Records
Tax History Compared to Growth
Tax History
| Year | Tax Paid | Tax Assessment Tax Assessment Total Assessment is a certain percentage of the fair market value that is determined by local assessors to be the total taxable value of land and additions on the property. | Land | Improvement |
|---|---|---|---|---|
| 2025 | $2,374 | $148,800 | $26,100 | $122,700 |
| 2024 | $2,374 | $131,100 | $22,600 | $108,500 |
| 2023 | $2,114 | $131,100 | $22,600 | $108,500 |
| 2022 | $2,096 | $98,600 | $17,900 | $80,700 |
| 2021 | $1,976 | $98,600 | $17,900 | $80,700 |
| 2020 | $2,048 | $87,800 | $15,800 | $72,000 |
| 2019 | $1,758 | $87,800 | $15,800 | $72,000 |
| 2018 | $1,734 | $73,900 | $13,100 | $60,800 |
| 2017 | $1,738 | $73,900 | $13,100 | $60,800 |
| 2016 | $1,688 | $72,800 | $12,600 | $60,200 |
| 2015 | $1,688 | $72,800 | $12,600 | $60,200 |
| 2014 | $1,526 | $68,500 | $11,600 | $56,900 |
Source: Public Records
Map
Nearby Homes
- 1603 Searle St
- 1601 E 22nd St
- 1614 Searle St
- 1410 E 23rd St
- 1424 E 21st St
- 1905 Searle St
- 1901 E 23rd St
- 1915 E 22nd St
- 1415 Delaware Ave
- 1821 E 25th St
- 2100 Searle St
- 1529 E 19th St
- 2112 E 23rd St
- 2021 E 25th St
- 2124 E 23rd St
- 1404 E 19th St
- 1311 E 25th Ct
- 2208 Tichenor St
- 2216 Lay St
- 1229 E 25th Ct