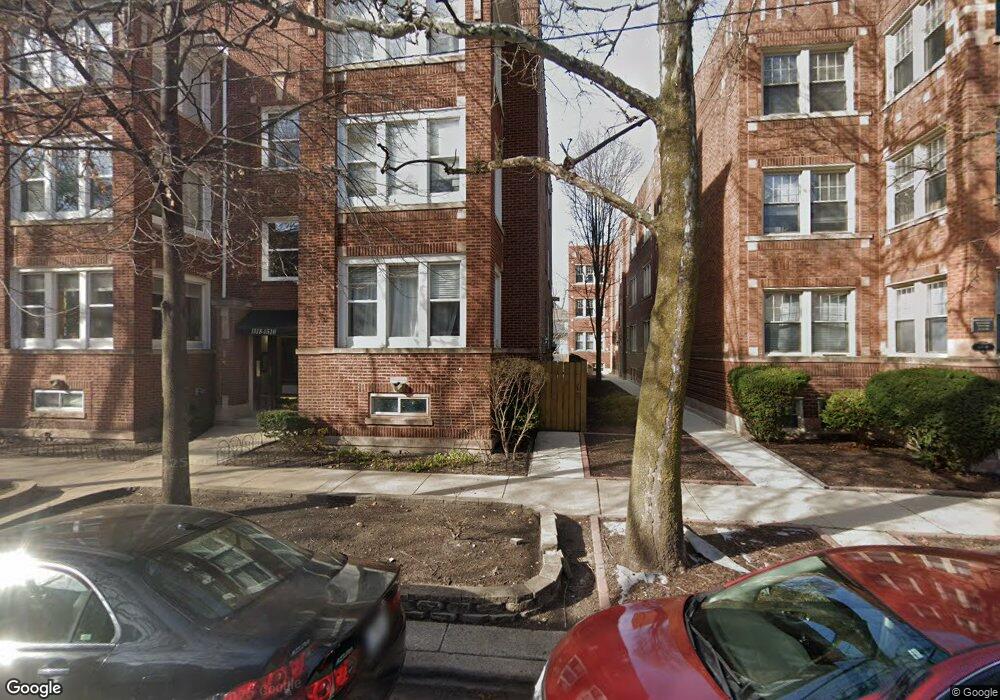
1516 W Rosemont Ave Unit 2E Chicago, IL 60660
Edgewater NeighborhoodEstimated Value: $347,000 - $470,000
2
Beds
1
Bath
1,200
Sq Ft
$328/Sq Ft
Est. Value
About This Home
This home is located at 1516 W Rosemont Ave Unit 2E, Chicago, IL 60660 and is currently estimated at $394,019, approximately $328 per square foot. 1516 W Rosemont Ave Unit 2E is a home located in Cook County with nearby schools including Hayt Elementary School, Senn High School, and Northside Catholic Academy.
Ownership History
Date
Name
Owned For
Owner Type
Purchase Details
Closed on
Oct 31, 2017
Sold by
Zalon Patricia
Bought by
Turrini Sharon
Current Estimated Value
Home Financials for this Owner
Home Financials are based on the most recent Mortgage that was taken out on this home.
Original Mortgage
$100,000
Outstanding Balance
$83,751
Interest Rate
3.83%
Mortgage Type
New Conventional
Estimated Equity
$310,268
Purchase Details
Closed on
Feb 10, 2005
Sold by
Olson Karen A
Bought by
Zalon Patricia
Home Financials for this Owner
Home Financials are based on the most recent Mortgage that was taken out on this home.
Original Mortgage
$93,000
Interest Rate
5.67%
Mortgage Type
New Conventional
Purchase Details
Closed on
Jun 15, 1999
Sold by
Nina Olshansky Co Inc
Bought by
Olson Karen A
Home Financials for this Owner
Home Financials are based on the most recent Mortgage that was taken out on this home.
Original Mortgage
$120,000
Interest Rate
7.15%
Create a Home Valuation Report for This Property
The Home Valuation Report is an in-depth analysis detailing your home's value as well as a comparison with similar homes in the area
Home Values in the Area
Average Home Value in this Area
Purchase History
| Date | Buyer | Sale Price | Title Company |
|---|---|---|---|
| Turrini Sharon | $255,000 | Chicago Title | |
| Zalon Patricia | $243,000 | Multiple | |
| Olson Karen A | $150,000 | -- |
Source: Public Records
Mortgage History
| Date | Status | Borrower | Loan Amount |
|---|---|---|---|
| Open | Turrini Sharon | $100,000 | |
| Previous Owner | Zalon Patricia | $93,000 | |
| Previous Owner | Olson Karen A | $120,000 |
Source: Public Records
Tax History Compared to Growth
Tax History
| Year | Tax Paid | Tax Assessment Tax Assessment Total Assessment is a certain percentage of the fair market value that is determined by local assessors to be the total taxable value of land and additions on the property. | Land | Improvement |
|---|---|---|---|---|
| 2024 | $4,672 | $30,179 | $9,953 | $20,226 |
| 2023 | $4,558 | $29,001 | $8,003 | $20,998 |
| 2022 | $4,558 | $29,001 | $8,003 | $20,998 |
| 2021 | $4,492 | $28,999 | $8,002 | $20,997 |
| 2020 | $4,833 | $27,902 | $4,601 | $23,301 |
| 2019 | $4,825 | $30,872 | $4,601 | $26,271 |
| 2018 | $4,877 | $30,872 | $4,601 | $26,271 |
| 2017 | $5,461 | $31,442 | $4,001 | $27,441 |
| 2016 | $5,797 | $31,442 | $4,001 | $27,441 |
| 2015 | $5,281 | $31,442 | $4,001 | $27,441 |
| 2014 | $4,818 | $28,537 | $3,050 | $25,487 |
| 2013 | $4,712 | $28,537 | $3,050 | $25,487 |
Source: Public Records
Map
Nearby Homes
- 1513 W Highland Ave
- 1542 W Highland Ave
- 1626 W Highland Ave Unit 1W
- 1457 W Rosemont Ave Unit G
- 6421 N Greenview Ave Unit 2W
- 6321 N Hermitage Ave
- 1723 W Thome Ave
- 6414 N Paulina St Unit G
- 1435 W Arthur Ave Unit 1
- 1748 W Granville Ave Unit 2A
- 1762 W Highland Ave Unit 104
- 6447 N Glenwood Ave
- 1331 W Granville Ave
- 6532 N Ashland Ave
- 6065 N Hermitage Ave
- 6220 N Ridge Ave Unit S203
- 1243 W Rosemont Ave Unit 12433
- 6328 N Magnolia Ave
- 6129 N Ravenswood Ave
- 6019 N Paulina St
- 1516 W Rosemont Ave Unit 3W
- 1516 W Rosemont Ave
- 1516 W Rosemont Ave Unit 1W
- 1516 W Rosemont Ave Unit 2E
- 1516 W Rosemont Ave Unit 1E
- 1516 W Rosemont Ave Unit 3E
- 1516 W Rosemont Ave Unit 1E
- 1516 W Rosemont Ave Unit G
- 1510-1514 W Rosemont Ave
- 1518 W Rosemont Ave Unit 2W
- 1518 W Rosemont Ave Unit 1W
- 1518 W Rosemont Ave Unit 3W
- 1518 W Rosemont Ave Unit 3
- 1534 W Rosemont Ave Unit 1534G
- 1534 W Rosemont Ave Unit 15343
- 1534 W Rosemont Ave Unit 15342
- 1534 W Rosemont Ave Unit 15341
- 1534 W Rosemont Ave Unit 2W
- 1534 W Rosemont Ave Unit 1W
- 1534 W Rosemont Ave Unit 3