1517 E Via Mirasol Ln Fresno, CA 93730
Woodward Park NeighborhoodEstimated Value: $586,065 - $637,000
4
Beds
3
Baths
2,029
Sq Ft
$302/Sq Ft
Est. Value
About This Home
This home is located at 1517 E Via Mirasol Ln, Fresno, CA 93730 and is currently estimated at $613,766, approximately $302 per square foot. 1517 E Via Mirasol Ln is a home located in Fresno County with nearby schools including James S. Fugman Elementary School, Granite Ridge Intermediate School, and Clovis North High School.
Ownership History
Date
Name
Owned For
Owner Type
Purchase Details
Closed on
May 10, 2021
Sold by
Migliore Carrie J and The David L Mcdonald Living Tr
Bought by
Wisler Richard A and Hogan Breelynn E
Current Estimated Value
Home Financials for this Owner
Home Financials are based on the most recent Mortgage that was taken out on this home.
Original Mortgage
$465,600
Outstanding Balance
$420,624
Interest Rate
2.9%
Mortgage Type
New Conventional
Estimated Equity
$193,142
Purchase Details
Closed on
Sep 24, 2019
Sold by
Migliore Carrie J
Bought by
Gillett Mcdonald Blake
Purchase Details
Closed on
Dec 16, 2015
Sold by
Parnagian Ross and Parnagian Alison
Bought by
Mcdonald David L
Purchase Details
Closed on
Nov 28, 2007
Sold by
Copper River Southwest Inc
Bought by
Parnagian Ross and Parnagian Alison
Home Financials for this Owner
Home Financials are based on the most recent Mortgage that was taken out on this home.
Original Mortgage
$355,197
Interest Rate
6.26%
Mortgage Type
Purchase Money Mortgage
Create a Home Valuation Report for This Property
The Home Valuation Report is an in-depth analysis detailing your home's value as well as a comparison with similar homes in the area
Home Values in the Area
Average Home Value in this Area
Purchase History
| Date | Buyer | Sale Price | Title Company |
|---|---|---|---|
| Wisler Richard A | $480,000 | Chicago Title Company | |
| Gillett Mcdonald Blake | -- | None Available | |
| Mcdonald David L | $390,000 | North American Title Co Inc | |
| Parnagian Ross | $444,000 | Financial Title Company |
Source: Public Records
Mortgage History
| Date | Status | Borrower | Loan Amount |
|---|---|---|---|
| Open | Wisler Richard A | $465,600 | |
| Previous Owner | Parnagian Ross | $355,197 |
Source: Public Records
Tax History Compared to Growth
Tax History
| Year | Tax Paid | Tax Assessment Tax Assessment Total Assessment is a certain percentage of the fair market value that is determined by local assessors to be the total taxable value of land and additions on the property. | Land | Improvement |
|---|---|---|---|---|
| 2025 | $6,833 | $519,566 | $135,304 | $384,262 |
| 2023 | $6,438 | $499,392 | $130,050 | $369,342 |
| 2022 | $6,285 | $489,600 | $127,500 | $362,100 |
| 2021 | $5,481 | $426,519 | $164,046 | $262,473 |
| 2020 | $5,517 | $422,146 | $162,364 | $259,782 |
| 2019 | $5,454 | $413,870 | $159,181 | $254,689 |
| 2018 | $5,341 | $405,756 | $156,060 | $249,696 |
| 2017 | $5,259 | $397,800 | $153,000 | $244,800 |
| 2016 | $5,116 | $390,000 | $150,000 | $240,000 |
| 2015 | $5,296 | $407,500 | $168,200 | $239,300 |
| 2014 | $5,043 | $381,600 | $157,500 | $224,100 |
Source: Public Records
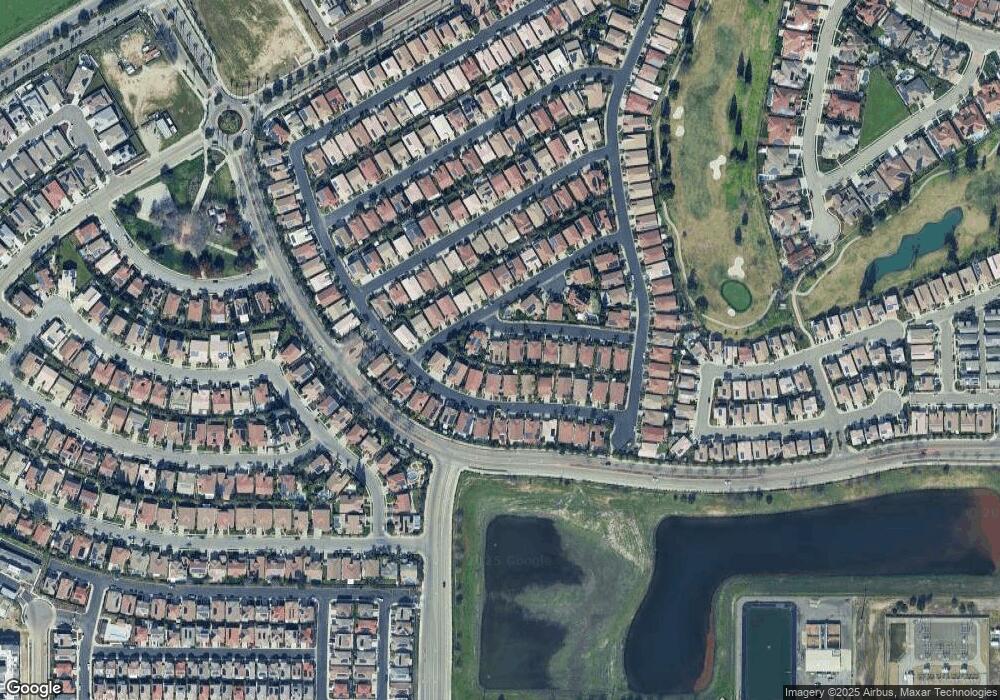
Map
Nearby Homes
- 11348 N Via Montessori Dr
- 11319 N Via Napoli Dr
- 11378 N Via Montessori Dr
- 1363 E Via Prato Dr
- 1396 E Via Prato Dr
- 11337 N Cherry Sage Ave
- 11333 N Garden Sage Ave
- 1645 E Benvenuto Dr
- 20164 Hazelwood Ln
- 10824 N Bunkerhill Dr
- 11617 N Bella Verde Ave
- 1138 E Royal Dornoch Ave
- 1558 E Shadow Creek Dr
- 1257 E Sarazen Ave
- 10668 N Oak Hill Cir
- 1391 E Rosemont Ln
- 10640 N Old Course Dr
- 10637 N Lochmoor Ln
- 10717 N Bunkerhill Dr
- 11350 N Glencastle Way
- 1517 E Via Mirasol Ln
- 1517 E Via Mirasol Ln
- 1517 E Via Mirasol Ln
- 1495 E Via Mirasol Ln
- 1533 E Via Mirasol Ln
- 1516 E Via Estrella Dr
- 1524 E Via Estrella Dr
- 1508 E Via Estrella Dr
- 1532 E Via Estrella Dr
- 1490 E Via Estrella Dr
- 11334 N Via Verona Way
- 1547 E Via Mirasol Ln
- 1464 E Via Estrella Dr
- 1540 E Via Estrella Dr
- 11325 N Via Verona Way
- 11329 N Via Verona Way
- 11321 N Via Verona Way
- 11333 N Via Verona Way
- 1551 E Via Mirasol Ln
- 11317 N Via Verona Way