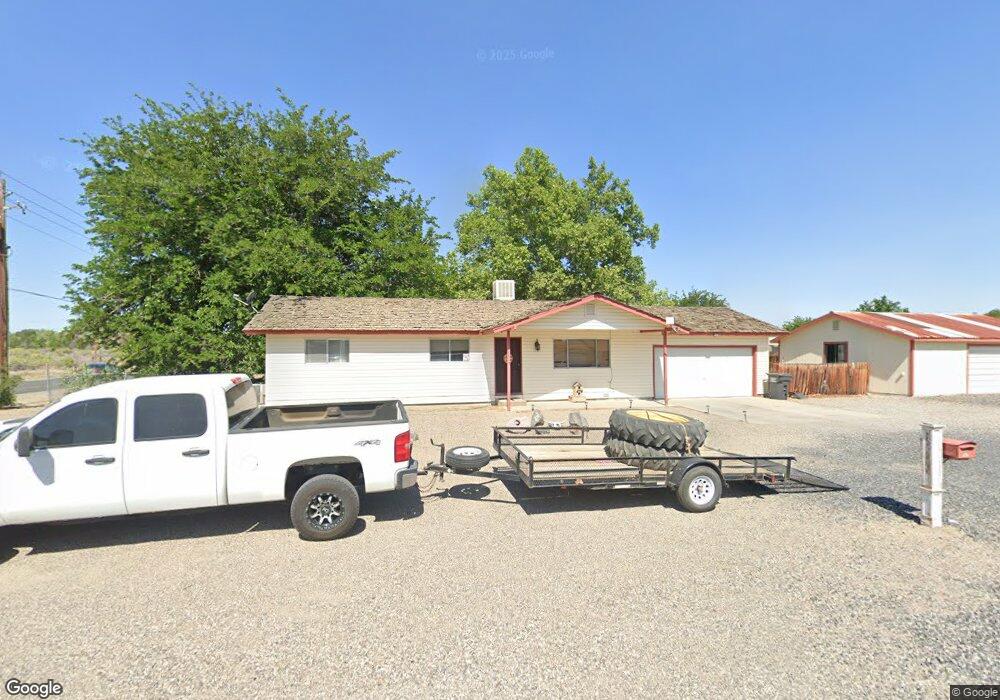
1517 Red Rd Fallon, NV 89406
Estimated Value: $312,012 - $347,000
3
Beds
2
Baths
1,196
Sq Ft
$276/Sq Ft
Est. Value
About This Home
This home is located at 1517 Red Rd, Fallon, NV 89406 and is currently estimated at $329,753, approximately $275 per square foot. 1517 Red Rd is a home located in Churchill County with nearby schools including E.C. Best Elementary School, Numa Elementary School, and Lahontan Elementary School.
Ownership History
Date
Name
Owned For
Owner Type
Purchase Details
Closed on
Mar 20, 2019
Sold by
Renfroe Ted Ray and Renfroe Judy Lee
Bought by
Renfroe Lori
Current Estimated Value
Purchase Details
Closed on
May 17, 2011
Sold by
Secretary Of Housing & Urban Development
Bought by
Renfroe Ted R and Renfroe Judy
Purchase Details
Closed on
Jul 26, 2010
Sold by
Bac Home Loans Servicing Lp
Bought by
The Secretary Of Housing & Urban Develop
Purchase Details
Closed on
Jun 28, 2005
Sold by
Smith Sidney L and Smith Sharon A
Bought by
Popejoy Timothy J and Popejoy Sandra D
Home Financials for this Owner
Home Financials are based on the most recent Mortgage that was taken out on this home.
Original Mortgage
$131,200
Interest Rate
6.37%
Mortgage Type
VA
Create a Home Valuation Report for This Property
The Home Valuation Report is an in-depth analysis detailing your home's value as well as a comparison with similar homes in the area
Purchase History
| Date | Buyer | Sale Price | Title Company |
|---|---|---|---|
| Renfroe Lori | -- | None Available | |
| Renfroe Ted R | $80,800 | Western Title Company | |
| The Secretary Of Housing & Urban Develop | $195,115 | First American Title Nationa | |
| Bac Home Loans Servicing Lp | $195,115 | First American Title Nationa | |
| Popejoy Timothy J | $164,000 | Western Nevada Title Company |
Source: Public Records
Mortgage History
| Date | Status | Borrower | Loan Amount |
|---|---|---|---|
| Previous Owner | Popejoy Timothy J | $131,200 |
Source: Public Records
Tax History
| Year | Tax Paid | Tax Assessment Tax Assessment Total Assessment is a certain percentage of the fair market value that is determined by local assessors to be the total taxable value of land and additions on the property. | Land | Improvement |
|---|---|---|---|---|
| 2025 | $1,355 | $58,815 | $23,450 | $35,365 |
| 2024 | $1,355 | $58,240 | $22,050 | $36,190 |
| 2023 | $1,355 | $56,519 | $22,050 | $34,469 |
| 2022 | $1,160 | $40,220 | $9,923 | $30,297 |
| 2021 | $1,108 | $39,637 | $9,923 | $29,714 |
| 2020 | $1,067 | $37,069 | $9,923 | $27,146 |
| 2019 | $1,051 | $36,511 | $9,923 | $26,588 |
| 2018 | $1,027 | $36,129 | $9,923 | $26,206 |
| 2017 | $997 | $36,451 | $9,923 | $26,528 |
| 2016 | $972 | $34,871 | $9,923 | $24,948 |
| 2015 | $954 | $33,595 | $9,923 | $23,672 |
| 2014 | $933 | $31,892 | $9,923 | $21,969 |
Source: Public Records
Map
Nearby Homes
- 1492 Del Rio Dr
- 1060 Penelope Dr
- 280 Hunter Park Way
- 815 Great Basin Ln
- 882 Great Basin Ln
- 800 Great Basin Ln
- 119 Toiyabe Ln
- 806 Karry Way
- 728 Keppel St
- 710 Keppel St
- 621 Keppel St
- 285 Amanda Ln
- 540 Michael Dr
- 618 Keppel St
- 530 Michael Dr
- 604 Keppel St
- 1049 Tamarack Ct
- 1677 Rio Vista Dr
- 604 Serpa Place
- 00 Serpa Place
Your Personal Tour Guide
Ask me questions while you tour the home.