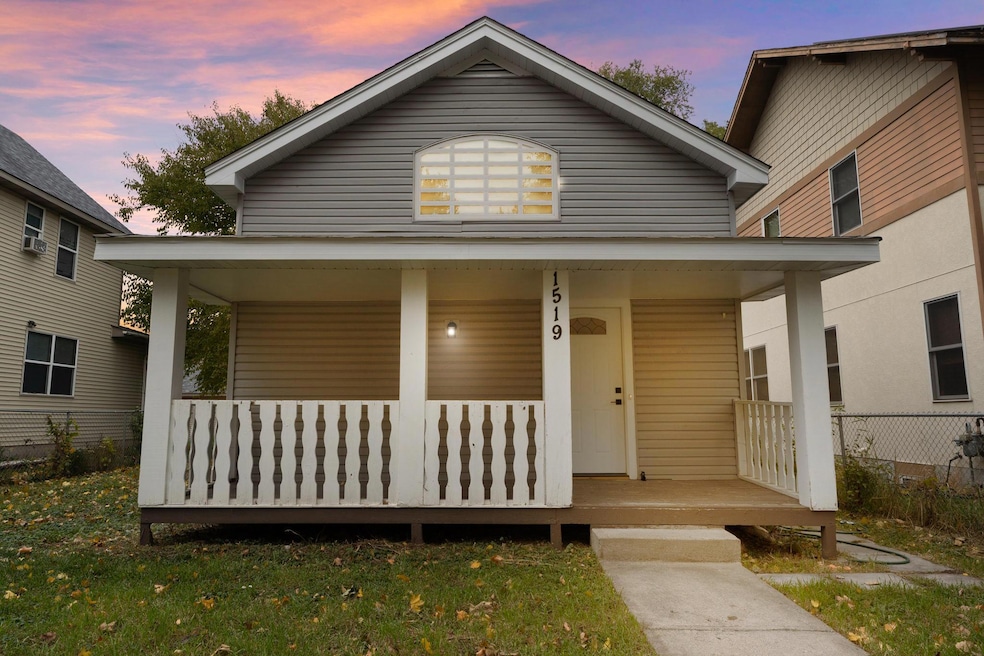
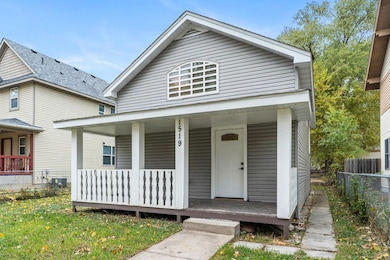
1519 Logan Ave N Minneapolis, MN 55411
Willard-Hay NeighborhoodEstimated payment $1,836/month
Highlights
- Deck
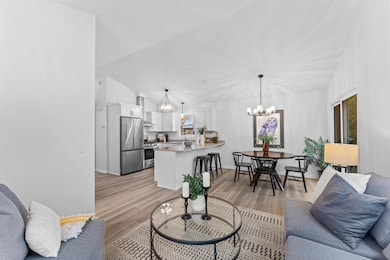
- Stainless Steel Appliances
- Entrance Foyer
- No HOA
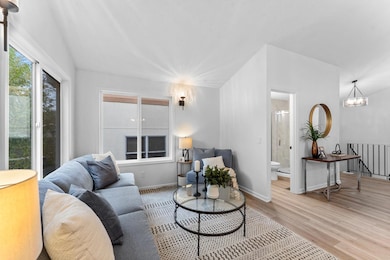
- Living Room
- 3-minute walk to North Commons Park
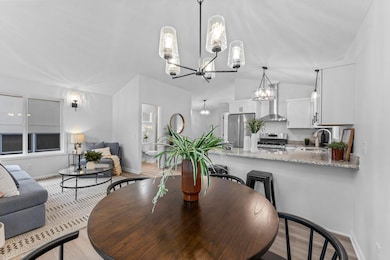
About This Home
Totally updated and like a new home in a great location, just steps away from North Commons Park. Immaculate and tastefully redone, updated home in the vibrant up-and-coming Near North neighborhood by the Highway 55 corridor. Less than 10 minutes to Target Field, Downtown Minneapolis, U.S. Bank Stadium. 5 minutes to the North Loop and shopping and entertainment district. 5 minutes to Theodore Wirth Park, golfing, and trails. Brand new appliances, mechanicals, roof, floors, etc. High-end finishes throughout the home. A great value in Minneapolis!
Home Details
Home Type
- Single Family
Est. Annual Taxes
- $3,153
Year Built
- Built in 1979
Lot Details
- 5,227 Sq Ft Lot
- Lot Dimensions are 40 x 125
- Chain Link Fence
- Cleared Lot
Parking
- Open Parking
Home Design
- Bi-Level Home
- Pitched Roof
- Vinyl Siding
Interior Spaces
- Entrance Foyer
- Living Room
- Dining Room
- Utility Room
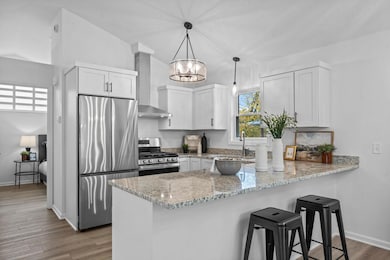
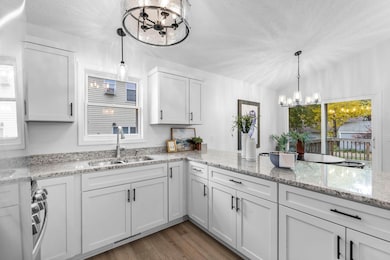
Kitchen
- Range
- Stainless Steel Appliances
Bedrooms and Bathrooms
- 4 Bedrooms
Laundry
- Dryer
- Washer
Finished Basement
- Basement Fills Entire Space Under The House
- Block Basement Construction
- Basement Window Egress
Outdoor Features
- Deck
Utilities
- Forced Air Heating and Cooling System
- Vented Exhaust Fan
- 150 Amp Service
- Gas Water Heater
- High Speed Internet
Community Details
- No Home Owners Association
- Rosedale Park Subdivision
Listing and Financial Details
- Assessor Parcel Number 1602924330087
Map
Home Values in the Area
Average Home Value in this Area
Tax History
| Year | Tax Paid | Tax Assessment Tax Assessment Total Assessment is a certain percentage of the fair market value that is determined by local assessors to be the total taxable value of land and additions on the property. | Land | Improvement |
|---|---|---|---|---|
| 2024 | $3,153 | $212,000 | $16,000 | $196,000 |
| 2023 | $2,958 | $211,000 | $16,000 | $195,000 |
| 2022 | $2,328 | $192,000 | $13,000 | $179,000 |
| 2021 | $1,772 | $168,000 | $10,000 | $158,000 |
| 2020 | $2,150 | $132,500 | $11,100 | $121,400 |
| 2019 | $1,291 | $120,500 | $7,400 | $113,100 |
| 2018 | $1,451 | $76,500 | $7,400 | $69,100 |
| 2017 | $1,221 | $69,000 | $6,700 | $62,300 |
| 2016 | $1,755 | $69,000 | $6,700 | $62,300 |
| 2015 | $1,453 | $69,000 | $6,700 | $62,300 |
| 2014 | -- | $66,500 | $6,700 | $59,800 |
Property History
| Date | Event | Price | List to Sale | Price per Sq Ft |
|---|---|---|---|---|
| 11/07/2025 11/07/25 | For Sale | $299,900 | -- | $248 / Sq Ft |
Purchase History
| Date | Type | Sale Price | Title Company |
|---|---|---|---|
| Warranty Deed | $240,000 | Watermark Title Agency | |
| Limited Warranty Deed | $67,900 | None Available | |
| Sheriffs Deed | -- | None Available | |
| Warranty Deed | $135,000 | -- | |
| Deed | $240,000 | -- |
Mortgage History
| Date | Status | Loan Amount | Loan Type |
|---|---|---|---|
| Open | $180,000 | New Conventional | |
| Closed | $180,000 | No Value Available |
Source: NorthstarMLS
MLS Number: 6815603
APN: 16-029-24-33-0087
Disclaimer: Certain information contained herein is derived from information provided by parties other than Homes.com. All information provided is deemed reliable, but is not guaranteed to be accurate and should be independently verified.
![]() Based on information submitted to the MLS GRID. All data is obtained from various sources and may not have been verified by broker or MLS GRID. Supplied Open House Information is subject to change without notice. All information should be independently reviewed and verified for accuracy. Properties may or may not be listed by the office/agent presenting the information. Some IDX listings have been excluded from this website.
Based on information submitted to the MLS GRID. All data is obtained from various sources and may not have been verified by broker or MLS GRID. Supplied Open House Information is subject to change without notice. All information should be independently reviewed and verified for accuracy. Properties may or may not be listed by the office/agent presenting the information. Some IDX listings have been excluded from this website.
The Digital Millennium Copyright Act of 1998, 17 U.S.C. § 512 (the “DMCA”) provides recourse for copyright owners who believe that material appearing on the Internet infringes their rights under U.S. copyright law. If you believe in good faith that any content or material made available in connection with our website or services infringes your copyright, you (or your agent) may send us a notice requesting that the content or material be removed, or access to it blocked.
Notices must be sent in writing by email to DMCAnotice@MLSGrid.com.
The DMCA requires that your notice of alleged copyright infringement include the following information:
(1) description of the copyrighted work that is the subject of claimed infringement;
(2) description of the alleged infringing content and information sufficient to permit us to locate the content;
(3) contact information for you, including your address, telephone number and email address;
(4) a statement by you that you have a good faith belief that the content in the manner complained of is not authorized by the copyright owner, or its agent, or by the operation of any law;
(5) a statement by you, signed under penalty of perjury, that the information in the notification is accurate and that you have the authority to enforce the copyrights that are claimed to be infringed; and
(6) a physical or electronic signature of the copyright owner or a person authorized to act on the copyright owner’s behalf. Failure to include all of the above information may result in the delay of the processing of your complaint.
- 1501 Logan Ave N
- 1429 Morgan Ave N
- 1623 Morgan Ave N
- 1332 Logan Ave N
- 1519 Oliver Ave N
- 1312 Knox Ave N
- 1722 James Ave N
- 1423 Penn Ave N
- 1313 Irving Ave N
- 1819 Newton Ave N
- 1400 Queen Ave N
- 1800 Penn Ave N
- 1211 Morgan Ave N
- 1210 James Ave N
- 1722 Queen Ave N
- 1336 Russell Ave N
- 1123 James Ave N
- 1214 Penn Ave N
- 1401 Fremont Ave N
- 1942 Oliver Ave N
- 1115 Humboldt Ave N
- 1800 Fremont Ave N
- 2000 W Broadway Ave NE
- 910 Oliver Ave N Unit 1
- 910 Oliver Ave N Unit 3
- 2327 Irving Ave N
- 716 Elwood Ave N
- 716 Elwood Ave N Unit Upper Level Unit
- 1618 Thomas Place N Unit 2
- 824 Russell Ave N
- 621 Morgan Ave N Unit 1
- 903 Sheridan Ave N Unit Upper Unit
- 835 W Broadway Ave
- 2505 Penn Ave N
- 1315 Olson Memorial Hwy
- 1422 26th Ave N Unit 1
- 560 Humboldt Ave N
- 2700 Irving Ave N Unit 2702
- 2622 Upton Ave N
- 416 10th Ave N
