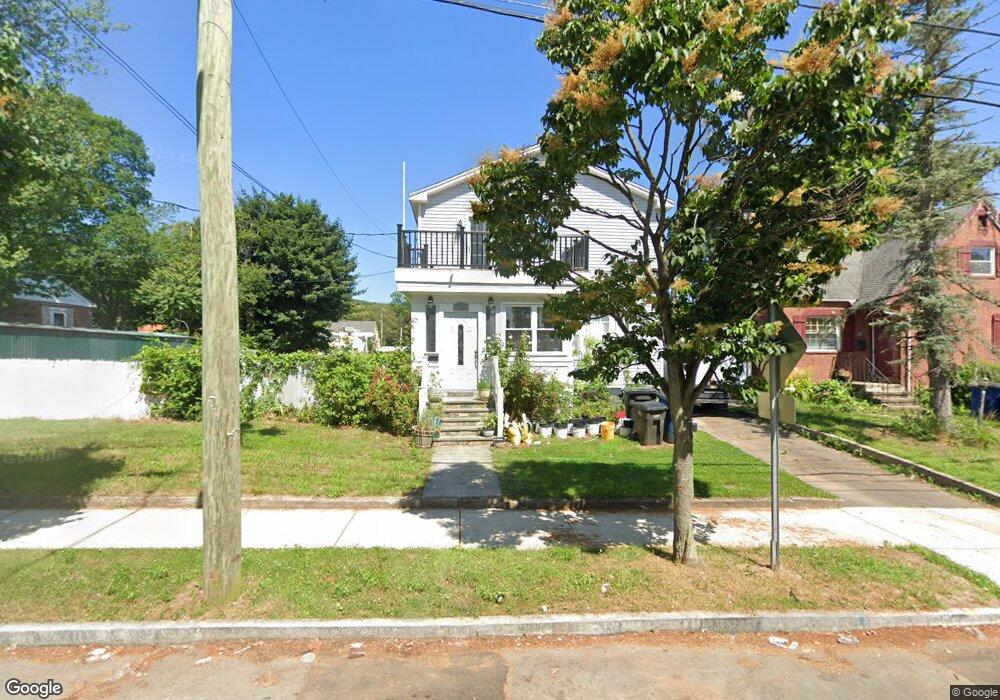
152 Ramsdell St New Haven, CT 06515
Amity NeighborhoodEstimated Value: $380,000 - $523,146
4
Beds
2
Baths
2,250
Sq Ft
$204/Sq Ft
Est. Value
About This Home
This home is located at 152 Ramsdell St, New Haven, CT 06515 and is currently estimated at $460,037, approximately $204 per square foot. 152 Ramsdell St is a home located in New Haven County with nearby schools including Elm City Montessori School and Hopkins School.
Ownership History
Date
Name
Owned For
Owner Type
Purchase Details
Closed on
Jun 1, 2018
Sold by
Lesano Edgar M
Bought by
Quituisaca Jose
Current Estimated Value
Purchase Details
Closed on
Jan 30, 2017
Sold by
Rodriguez Ana
Bought by
Lesano Edgar M
Purchase Details
Closed on
Oct 7, 2010
Sold by
Department Of Housing & Urban Dev
Bought by
Rodriguez Ana
Home Financials for this Owner
Home Financials are based on the most recent Mortgage that was taken out on this home.
Original Mortgage
$50,000
Interest Rate
4.37%
Purchase Details
Closed on
Aug 5, 2009
Sold by
Citimortgage Inc
Bought by
Department Of Housing & Urban Dev
Purchase Details
Closed on
Mar 21, 1994
Sold by
Alvarado Jose R and Verrengia Mary E
Bought by
Benson Jerrey and Benson Stephanie N
Home Financials for this Owner
Home Financials are based on the most recent Mortgage that was taken out on this home.
Original Mortgage
$109,200
Interest Rate
6.9%
Mortgage Type
Unknown
Create a Home Valuation Report for This Property
The Home Valuation Report is an in-depth analysis detailing your home's value as well as a comparison with similar homes in the area
Home Values in the Area
Average Home Value in this Area
Purchase History
| Date | Buyer | Sale Price | Title Company |
|---|---|---|---|
| Quituisaca Jose | $170,000 | -- | |
| Lesano Edgar M | -- | -- | |
| Rodriguez Ana | $55,000 | -- | |
| Department Of Housing & Urban Dev | -- | -- | |
| Benson Jerrey | $110,000 | -- |
Source: Public Records
Mortgage History
| Date | Status | Borrower | Loan Amount |
|---|---|---|---|
| Previous Owner | Benson Jerrey | $50,000 | |
| Previous Owner | Benson Jerrey | $5,300 | |
| Previous Owner | Benson Jerrey | $109,200 |
Source: Public Records
Tax History Compared to Growth
Tax History
| Year | Tax Paid | Tax Assessment Tax Assessment Total Assessment is a certain percentage of the fair market value that is determined by local assessors to be the total taxable value of land and additions on the property. | Land | Improvement |
|---|---|---|---|---|
| 2025 | $8,268 | $209,860 | $47,390 | $162,470 |
| 2024 | $8,080 | $209,860 | $47,390 | $162,470 |
| 2023 | $7,807 | $209,860 | $47,390 | $162,470 |
| 2022 | $8,342 | $209,860 | $47,390 | $162,470 |
| 2021 | $5,474 | $124,740 | $28,420 | $96,320 |
| 2020 | $5,474 | $124,740 | $28,420 | $96,320 |
| 2019 | $5,361 | $124,740 | $28,420 | $96,320 |
| 2018 | $5,361 | $124,740 | $28,420 | $96,320 |
| 2017 | $4,825 | $124,740 | $28,420 | $96,320 |
| 2016 | $4,558 | $109,690 | $28,420 | $81,270 |
| 2015 | $4,558 | $109,690 | $28,420 | $81,270 |
| 2014 | $4,517 | $108,710 | $28,420 | $80,290 |
Source: Public Records
Map
Nearby Homes
- 61 Anthony St
- 136 Rock Creek Rd
- 18 Hilltop Rd
- 57 Rock Creek Rd
- 233 Valley St
- 360 Fountain St Unit 5
- 36 Birch Dr
- 119 Brooklawn Cir
- 51 Fountain Terrace
- 120 Emerson St
- 1681 Litchfield Turnpike
- 1016 Whalley Ave Unit 6
- 999 Whalley Ave Unit 1H
- 126 Willard St
- 827 Fountain St
- 70 Fountain St Unit 4
- 12 Whisper Ridge Way Unit 45
- 12 Whisper Ridge Way
- 14 Whisper Ridge Way Unit 46
- 8 Whisper Ridge Way
- 142 Ramsdell St
- 127 Westerleigh Rd
- 125 Westerleigh Rd
- 129 Westerleigh Rd
- 1374 Whalley Ave
- 1374 Whalley Ave Unit 1
- 136 Ramsdell St
- 1384 Whalley Ave
- 119 Westerleigh Rd
- 132 Ramsdell St
- 149 Ramsdell St
- 113 Westerleigh Rd
- 145 Ramsdell St
- 154 Westerleigh Rd
- 150 Westerleigh Rd
- 124 Ramsdell St
- 141 Ramsdell St
- 7 Frederick St
- 107 Westerleigh Rd